Optimizing the Confluent Platform release pipeline
Continuous delivery is often treated as a cloud-only feature. On-premises software still follows release cycles measured in months. We, too, started with package build times exceeding seven hours, weeks of stabilization across a dozen product teams, and releases that took months. Now we produce a production-ready release in about 3–4 days and ship several components independently. Customers get faster releases, and we get to spend more time writing software instead of babysitting build jobs.
Below is the journey of Confluent Platform (CP), a self-managed data streaming platform that enterprises run in their data centers and private clouds. CP includes Confluent Server (enterprise-grade Apache Kafka®) at its core, bundled with other essential components including Schema Registry, Connect, and Apache Flink®.
Looking back — 7.5 hours just to build the package
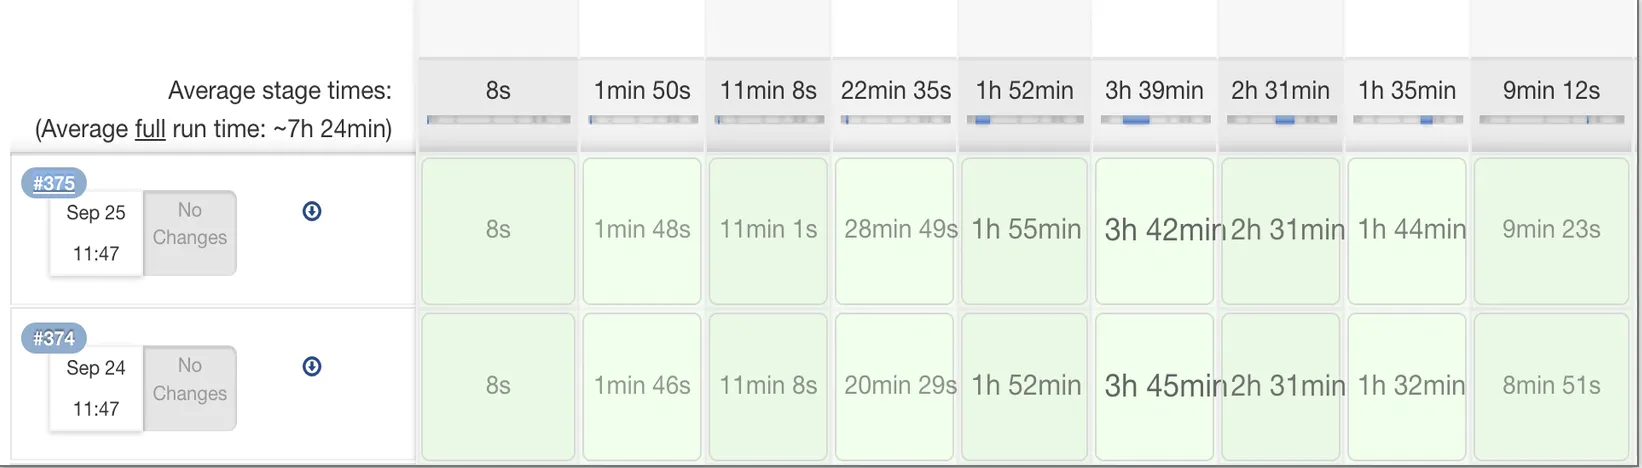
The process started with building Confluent Server first, followed by the rest of the components — eventually assembling a suite of shippable packages.
A Jenkins packaging job that output the entire suite after its run took between 7 and 15 hours. This was made up of several chunks of time, including:
- Prep time: ~50 minutes for checkout, build-machine provisioning, and environment setup
- ~3.5 hours to build the packages
- ~2 hours to deploy to repositories and run smoke tests
So ~7.5 hours total when everything succeeded — and if it failed, the marathon repeated.
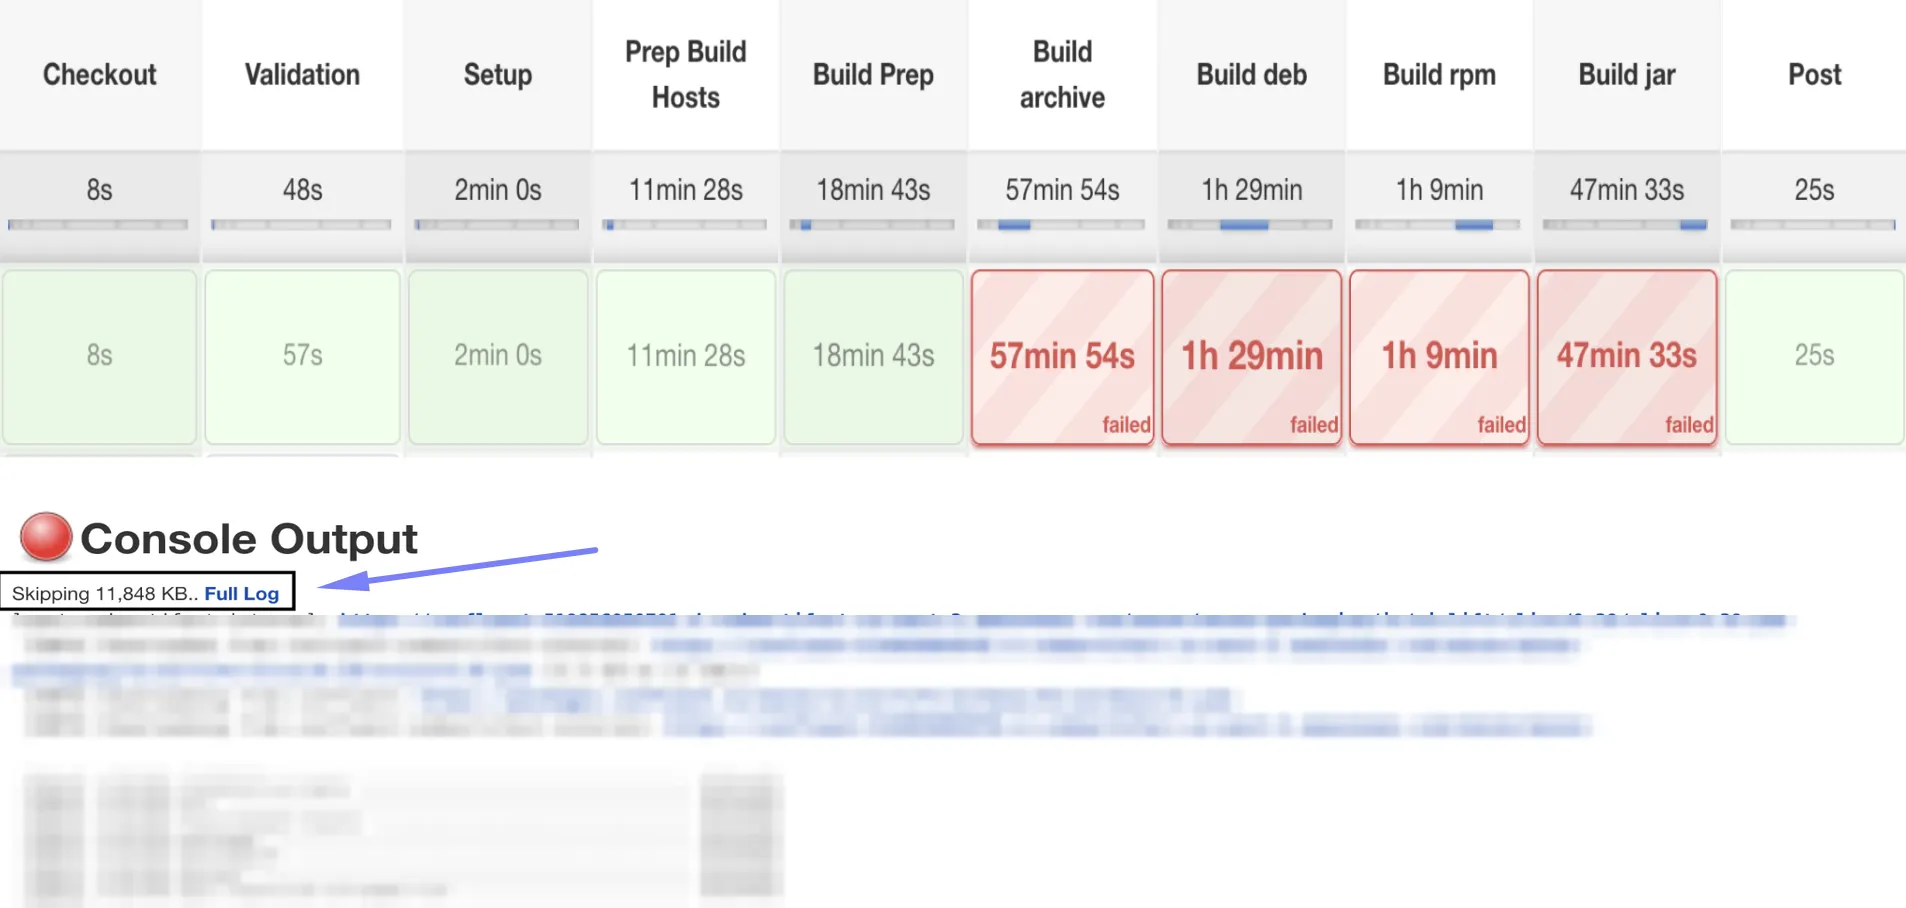
Failure could stem from one of the components. With a single job, patiently combing through the job log was the approach to triage the root cause. We would eventually achieve one green build in months, requiring a lot of coordination and fixes. A green build was only the beginning; passing platform-level integration tests was the hardest part.
What changed and what worked
If we want continuous delivery, we should apply its principles and the results will follow. That meant we should:
- Fail fast, fix fast.
- Keep mainline always releasable.
- Make the pipeline itself observable and measurable.
- Everyone owns quality, unify quality into a single, shared metric.
- Clear separation of interfaces from implementations.
- Test continuously, not just at the end.
- Small, frequent, incremental changes.
- Loosely coupled architecture enables independent delivery.
This journey began by fixing the build pipeline, which then unlocked everything else. Each change below builds on the previous ones and together they turned a multi-day build into near-continuous delivery.
The build pipeline
Principles: Fail fast, fix fast, keep mainline always releasable, make the pipeline itself observable and measurable.
Rebuilding the build pipeline
As a company, we were moving to a Semaphore-based build pipeline from Jenkins to meet security and compliance requirements. Instead of doing a lift and shift, we used this opportunity to split our build into clear sequential and parallel stages. The build pipeline graph reduced overall build time to about 2 hours due to parallelization at various levels. Each intermediate stage could be attributed to a specific team's repository. This visibility helped us create automated build-notifications that inform the respective team to take action. Net impact: 80% faster builds with team attribution.
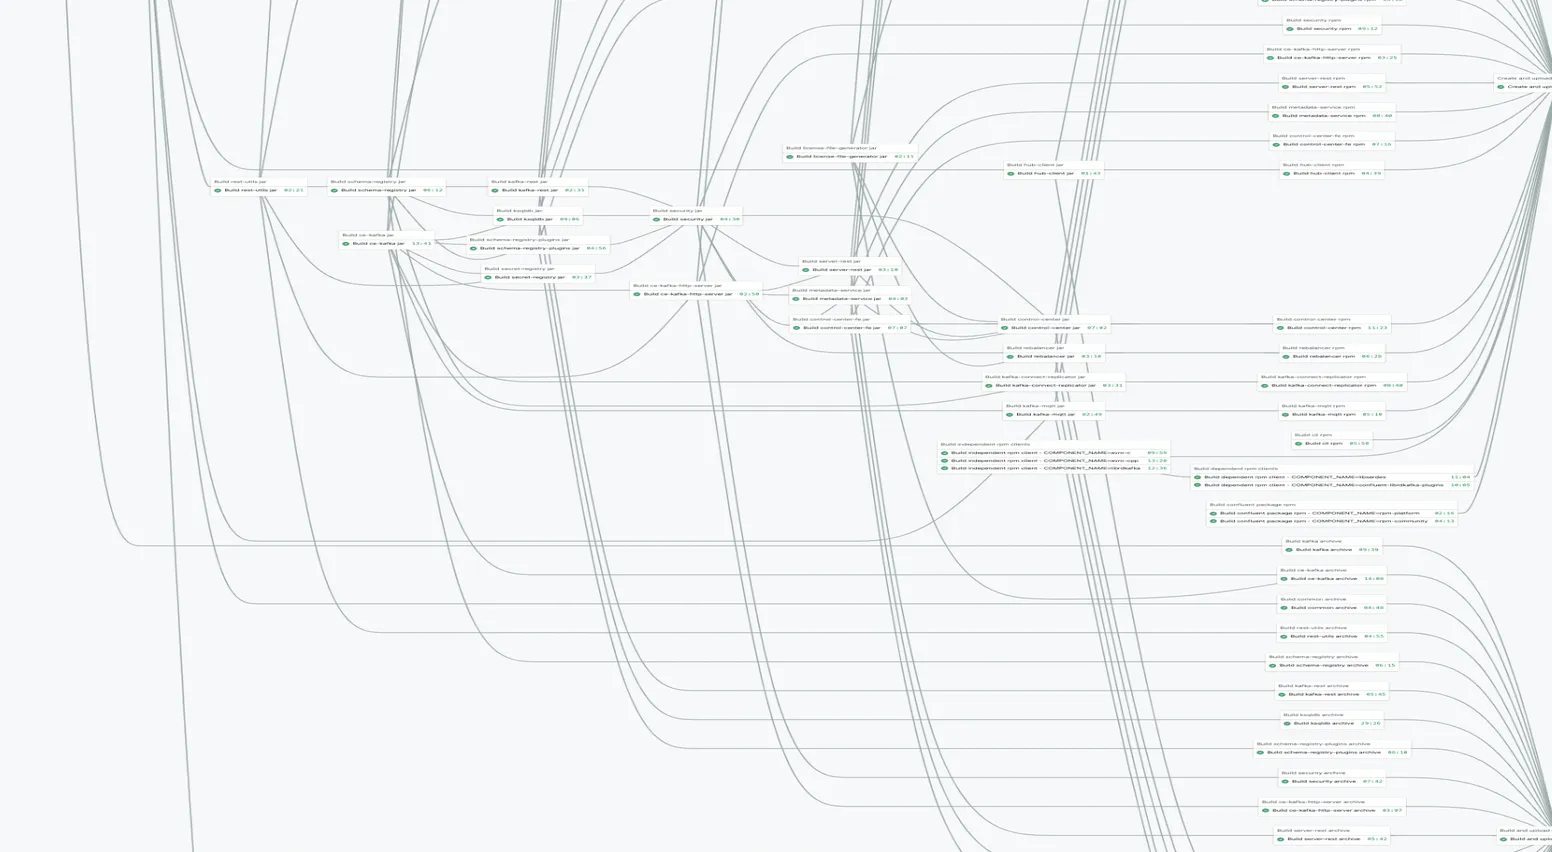 Segment of the new parallelized workflow
Release branches instead of repository locking
The CP package is built from around 136 repositories. Our approach was to lock these repositories once release activities began. After release, we created a release tag in the repositories and unlocked them. This locking phase impacted development of teams on CP and the timeline of subsequent releases too. Above all, the team faced a flood of commits when the repositories were unlocked — this was not CI.
As the build time reduced, we could not only build faster, but also build more. We changed our branching strategy by adopting an exclusive release branch approach and moving away from locking branches. We could run multiple release branches in parallel. In summary, this enabled teams to continue development and improved branch stability during development and releases.
Pilot builds that gate every PR
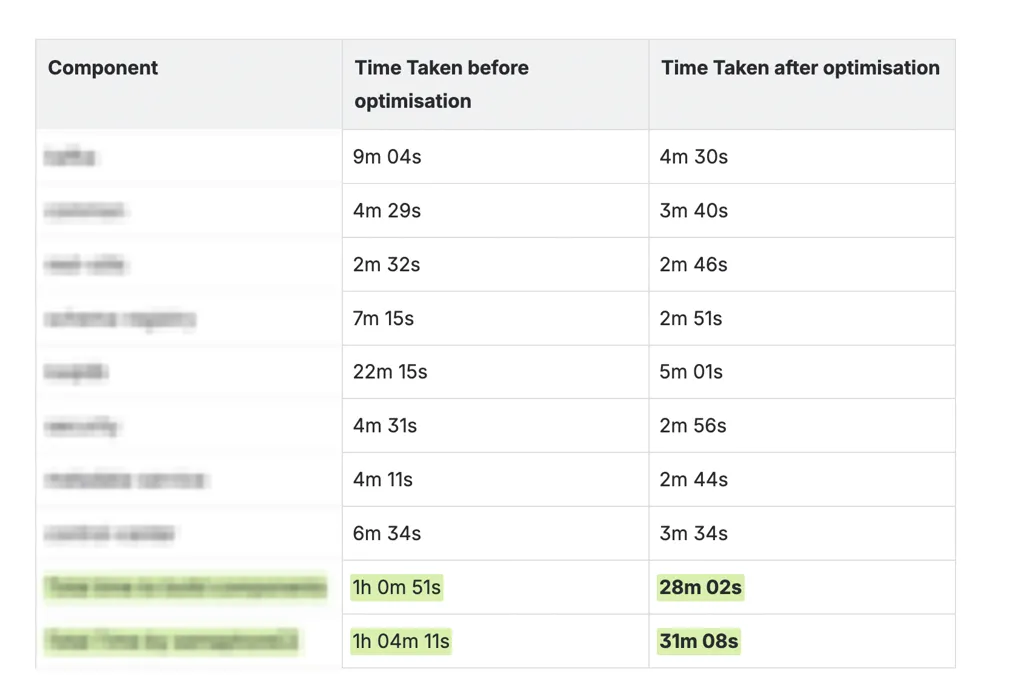
A typical build runs SpotBugs, Checkstyle, generates an SBOM and Javadoc, records git commit IDs, and produces other artifacts. Upstream artifacts are published to package repositories for downstream use. Our build failed mainly because of API changes in our code, so the intent was to validate those in the PR and nothing else. The new pilot build disabled unrelated Maven plugins and used the Semaphore CI artifact store for downstream stages. In about 30 minutes you know whether your PR will impact anything downstream after it's merged to master.
Impact: Frequency of green master builds improved and builds remained green throughout development.
Treating pipeline failures like customer incidents
We secured an executive mandate that CP pipeline failures match customer issues at severity level 2 (SEV-2). In the customer context, SEV-2 means the incident has degraded multiple customers' experience. This severity level seemed appropriate for pipeline failures. With this process, any pipeline failure had to be fixed within SEV-2 timelines. This required triaging issues quickly to assign them to the correct team.
Using AI to triage pipeline failures
This triaging system has evolved over time and now uses AI. The AI agent with MCP and tools automatically downloads complete logs from the CI system, analyzes the failure, maps it to the component causing the build failure, compares branches to identify the likely commit, and proposes a fix — either a test change or a code change. More importantly, team mapping ensures the program manager can identify the responsible team with AI support, so no engineer is needed solely for triage. Further AI automation steps assist the engineer from the identified team.
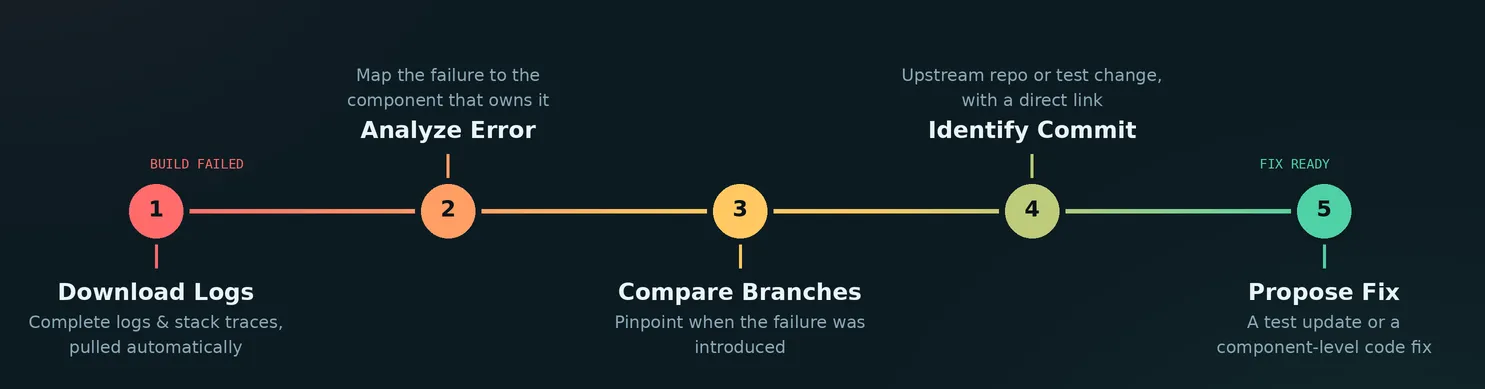 Automated AI triage workflow (60 min manual triage → 3 min with AI)
Platform testing
Principles: Everyone owns quality, unify quality into a single, shared metric; clear separation of interfaces from implementations; test continuously, not just at the end.
TQS — single metric for test health
As build issues and times decreased, test failures became the next bottleneck.
We faced flaky, long-running, and blocked tests, and issues in the platform testing infrastructure. The teams needed a single metric to indicate their test suite health to guide improvements. We created a metric called Test Quality Score (TQS) that includes all these dimensions: passed tests, flaky tests, failed tests, skipped tests, and tests passing on multiple runs. We defined TQS for our infra team to ensure the test infrastructure does not cause issues. The infra team must meet the same standards as the team writing the tests, so "blame the infra" isn't a way out for anyone. For over a year, all teams have improved the TQS to 9.8 out of 10. As a result of the test suite stability, our testing and triaging cycle for release candidates (RC) now takes only a few days.
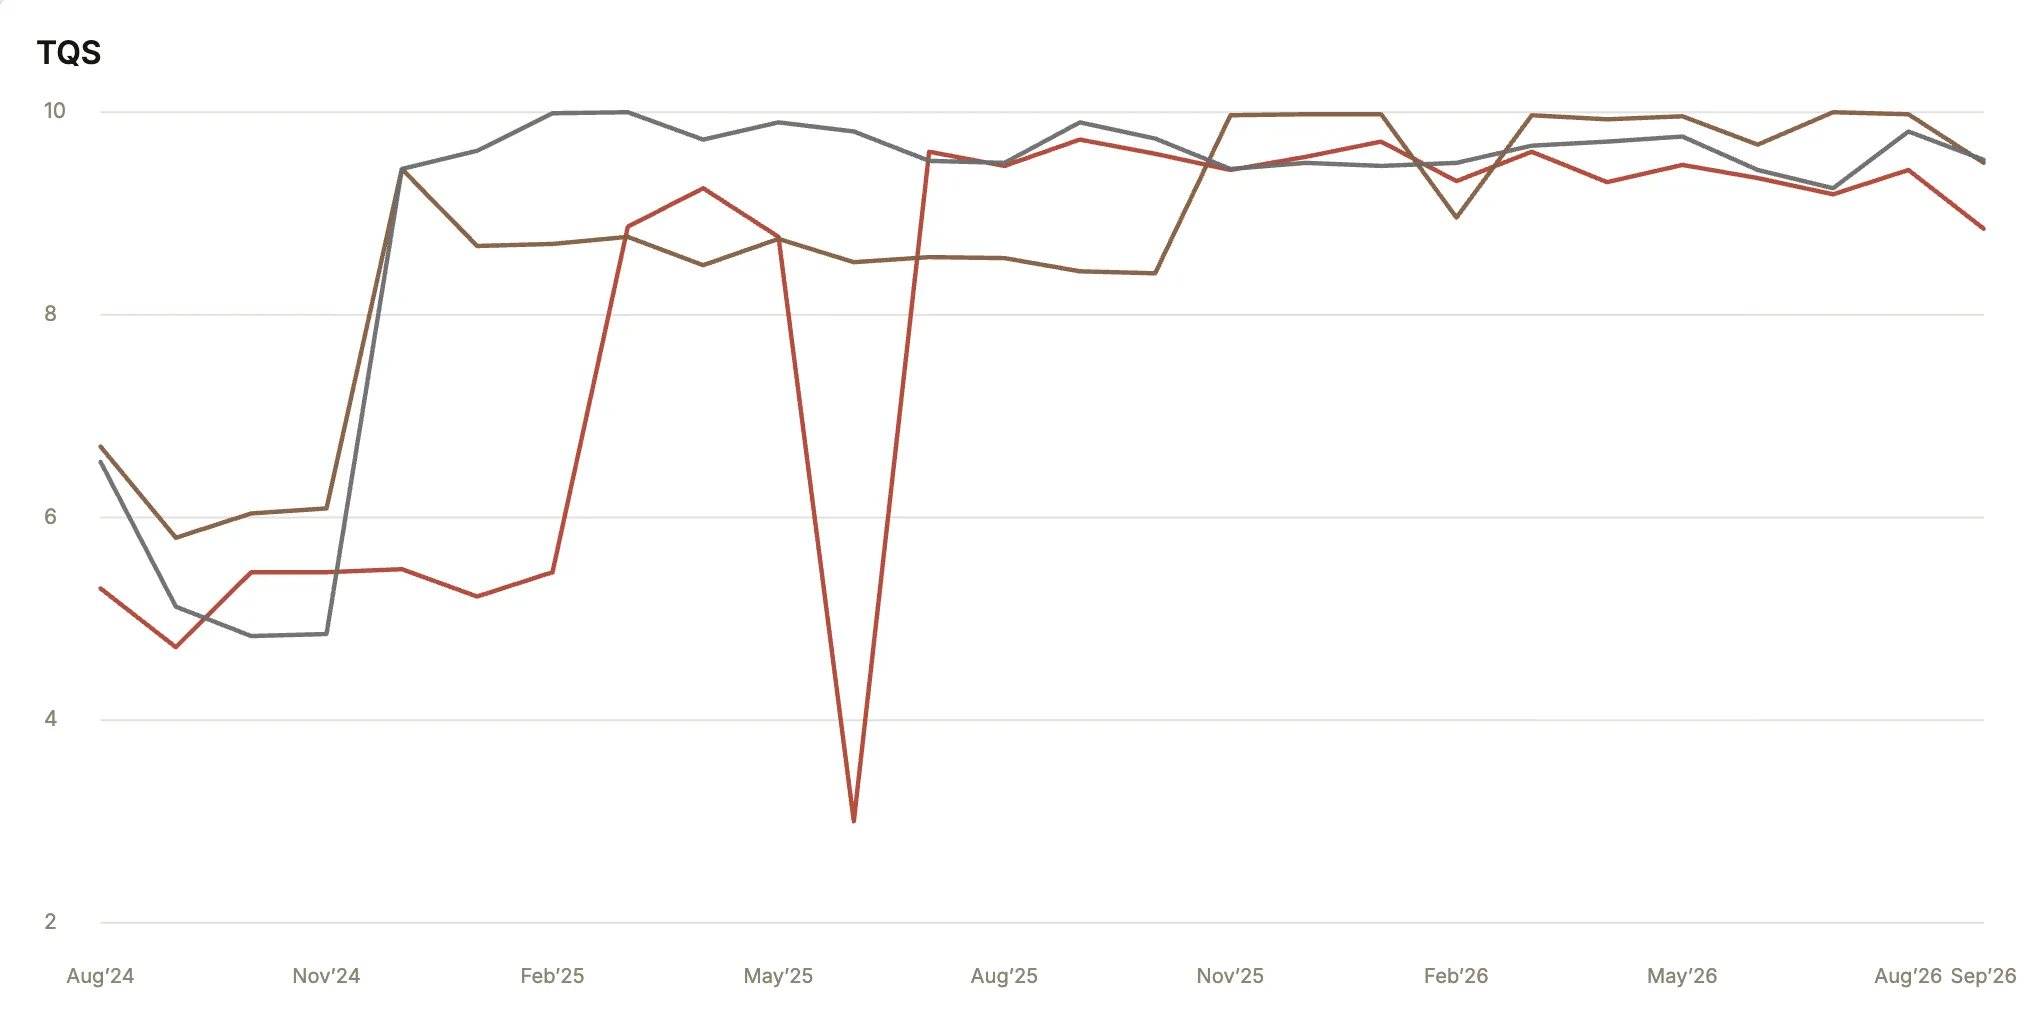 TQS Line Chart for Orgs (names hidden)
Separating the test framework from the tests
We have a homegrown test framework, Muckrake, that lets developers launch CP components in their preferred configuration, run tests, and assert outcomes — deployments that mirror real customer environments.
Here is a sample DSL for our test framework:
# ── Declare the Confluent Platform you want ──

cp = Cluster(name="cp-c3-sr-connect-smoke", nodes=8)

# Each service is a declaration: size + config + what it depends on.
kafka = cp.declare(
    Kafka,
    brokers        = 3,
    mode           = "KRaft",
    replication    = 3,
    overrides      = {
        "offsets.topic.replication.factor":            3,
        "transaction.state.log.replication.factor":    3,
        "transaction.state.log.min.isr":               2,
    },
)

schema_registry = cp.declare(SchemaRegistry, nodes=1, backed_by=kafka)

connect = cp.declare(Connect, nodes=1, backed_by=kafka, plugins=[])

control_center = cp.declare(
    ControlCenter,
    backed_by = kafka,
    wires = {
        "schema_registry": schema_registry,   # C3 talks to SR
        "connect":         {"connect-cluster": connect},
    },
)

# ── Muckrake resolves the dependency graph and provisions the whole stack ──
cp.bring_up()
#   1. allocate 8 nodes            (3 kafka · 1 sr · 1 connect · 1 c3 · headroom)
#   2. install the right CP packages on each
#   3. start in dependency order:  kafka → schema_registry → connect → control_center

# ── State the health you expect — muckrake waits and asserts for you ──
cp.expect(kafka).all_brokers_running()
cp.expect(schema_registry).responds_at("/")
cp.expect(connect).rest_endpoint_ready()
cp.expect(control_center).clusters_api() == 200
The framework was tightly coupled to the tests and to CP versions, so every framework fix had to be back-ported and re-validated across branches. This had to change — time to separate the test framework from the CP tests. The test framework's evolution and stability have improved TQS and removed the need to maintain multiple versions of the framework for each CP version.
Shifting "Customer Zero" left
We have Customer Zero — a long-lived environment where a release candidate bakes for a few days before launch. Since this environment is persistent, slow memory leaks and performance issues in the release candidate caused by data volume surface over time. It's essential for upgrade testing too — making sure a new release doesn't break an existing deployment. But it had a catch: once you upgrade Customer Zero, you can't re-test that same upgrade. We had already upgraded the Customer Zero environment partially, so reverting to the old state was not feasible. We had resorted to performing the upgrade test only once — on the final RC. Validating only the final RC pushed upgrade issues to nearly the last step, where they're most expensive to find and fix. So we invested in automation that stands up a fresh Customer-Zero-like environment directly from a branch build — not just from an RC. That shifted validation left: we can now tear down and rebuild an older CP version and upgrade it as many times as we need.
Faster iteration for customers
Principles: Small, frequent, incremental changes; loosely coupled architecture enables independent delivery.
Merging Apache Kafka code in lock-step
CP is always a superset of Apache Kafka (AK); every feature of AK is available to CP customers. CP releases follow AK releases. AK 3.9 ships in CP 7.9; AK 4.0 is included in CP 8.0, and so on. The gap between AK and CP releases used to span months because AK commits were merged into CP only after each AK release — there would be a significant backlog of commits to be merged. The Kafka team changed this by merging AK commits into CP simultaneously, in lock-step. Since last year, we have released CP within two weeks of the corresponding AK release, so CP customers get new Kafka features nearly as fast as open-source users do.
Releasing components independently
Several CP components — control-plane pieces like Confluent Control Center, the Gateway, and the Ansible and CFK (Confluent for Kubernetes) deployment tools — can evolve faster than the core data plane and support multiple CP versions.
Historically, customers had to upgrade their data plane Kafka to get any new feature or fix in these components, and a core upgrade is a multi-quarter effort that often gets deferred — leaving customers stuck with a subpar experience they didn't need to have. So we broke CP open and began releasing these components independently. Customers get a better experience from the parts that move fast, without waiting on a full-platform upgrade of the data plane.
Where we are now and the future
We can release CP components independently to improve the customer experience and speed up adoption, which lets us iterate and learn faster. We can ship the entire core platform within two weeks to deliver security patches and critical fixes. The two-week timeframe starts with CVE identification, severity triaging, assignment to teams, new branch for the fix, common package updates, fixing of CVE by each team, integration test runs and fixes, CVE fix verification with security scan, and making the package ready. The next step is to patch issues in container images, which include CVE fixes in base OS images and tools, image creation, and CVE fix verification on images. Finally, we publish both packages and container images to public repositories.
Having changed the status quo for two years running, we're now preparing for a 48-hour release — moving toward genuine continuous delivery for on-premises software, something the industry has long treated as the exclusive domain of the cloud.
AI is part of that next step. We're extending it beyond failure triage into auto-analysis and auto-remediation for builds and tests. We are also integrating performance benchmarking into the automated release pipeline, so that performance regressions are caught and validated without human intervention.
And, we'll keep sharing what works as we go.