From 6 Hours to 1 Minute: Checkpointing Kubernetes-style Controllers
We run Confluent Cloud on the three main clouds in over a hundred regions, with over 80,000 customer Kafka clusters on more than 4,000 K8s clusters, writing over 3 trillion messages a day. One of the core parts of our infrastructure is the use of K8s and K8s-style controllers to operate many of the services that we offer.
K8s controllers are an amazing pattern but have a weak point that was exposed at Confluent’s scale: the cold start. A cold start means that, when restarted, the controller needs to read the desired state for each and every object it controls and check its current state. For many a modest K8s deployment with up to thousands of resources, this is a non-significant event. For us at Confluent Cloud though, this means reading over 115 GB covering more than 25 million objects from the database.
In this post, we’ll take controllers apart, showing how they work under the hood, and demonstrate how we’ve side-stepped the cold start problem by developing a framework that allows controllers to resume from where they left off without losing any events. For our biggest controller, restart time dropped from 6 hours to 1 minute!
Meet the Resource Platform
Previously, we mentioned K8s-style controllers, but what does that mean?
For readers not familiar with the concept, allow me to quote from the K8s documentation:
“In Kubernetes, controllers are control loops that watch the state of your cluster, then make or request changes where needed. Each controller tries to move the current cluster state closer to the desired state”.
In other words, controllers are the basic building block for K8s reacting to changes: every time you change something in a K8s object (like the number of replicas of a deployment), a controller is triggered and aligns the current state with the desired state.
At Confluent, we do use vanilla K8s controllers with etcd for some use cases, but for our internal resources and metadata we cannot rely on K8s storage, so we needed a similar abstraction that works in a unified way across all the clouds and regions we run in, at a scale that exceeds what a single K8s control plane can hold. For these reasons, we’ve developed a spin-off of the K8s apiserver and its built-in controllers (kube-controller-manager) and a custom watch protocol, called the Resource Platform.
The idea is simple and powerful: Our engineers are familiar with K8s and its data model, and the controller pattern is great for managing resources—so why don’t we create an in-house solution that works exactly like that?
This is a simplified view of our Resource Platform:
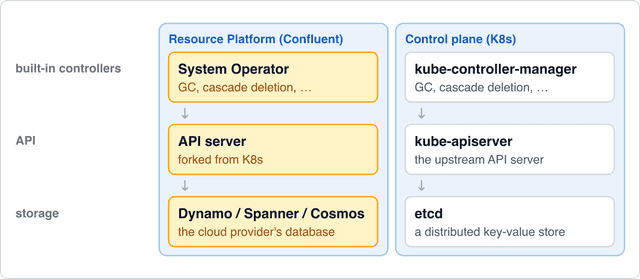
I’ve said that our Resource Platform is a spin-off because not only do we follow the same K8s architecture, but we rely on K8s open-source libraries and forked some of them.
The biggest difference is we don’t use etcd—it wouldn’t work at our scale because of the size limit—so we have horizontally scalable databases and adapted some of the components and the architecture to work for our data model.
The Resource Platform alone would be worth a blog post, but what we’re focusing on in this one is that our controllers behave like K8s ones. We use the upstream controller-runtime library, plus our own copy of some of its packages, adapted to our platform but with the same interfaces.
The cold start problem
Let’s talk a bit more about the K8s architecture for controllers. Take the Job controller as an example: it watches Jobs to find new work, and Pods to know when the work is done.
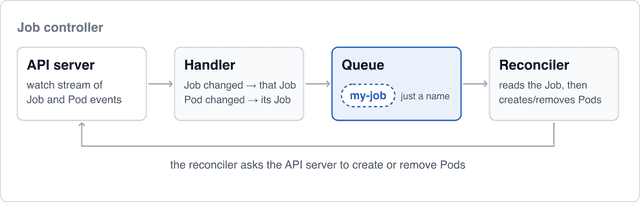
In general, when a controller is notified of a change to a resource it is watching, it can enqueue 0..N requests. In more detail:
- The controller-runtime manager creates the controller for a resource, which can own/watch multiple resources.
- A source (in vanilla K8s, the informer cache) is started, which lists and caches all existing objects and opens a watch for live events. For each object listed, an event is emitted.
- Events are processed from the handler, which will enqueue 0..N requests on the queue.
- The queue handles deduplication and rate limiting for errors and retries. A separate delay heap is kept for delayed/requeued items.
- A worker pool (the controller) processes these requests.
- Reconciler code is run to actuate the desired state.
- Live events keep arriving, and they are processed through the same pipeline.
Here are three different events going through the pipeline:
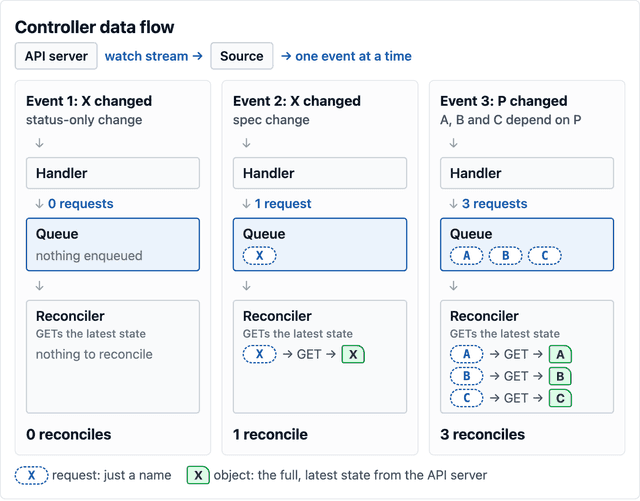
Step 2 is the cold start: Every time a controller starts, it reads the current state for all the resources it is watching. If you are watching 100k Pods, all of them will be read and reconciled.
The time this takes grows with the number of objects, and controllers restart a lot more than you think: every deploy, every node rotation, on leader election. Each one means the time penalty of re-reading all the resources again. (K8s informers can also periodically replay every object to the controller, a resync, but that comes from the local cache and doesn't read the storage again.)
Cold starts in vanilla K8s
Is this a problem in vanilla K8s? Yes and no. We briefly mentioned etcd size limits before: that’s what keeps cold starts manageable in a typical K8s deployment, as the data is bounded to a few GBs. Despite 8 GB being just a suggested limit, and not enforced by etcd, managed services set that bound for you: Amazon EKS provisions etcd with an 8 GB database, and GKE lists a 6 GB limit for the cluster state database. If you run etcd yourself you can technically go over the limit, but it is not recommended. Cloud providers do offer special variants with higher limits: EKS ultra-scale clusters are opt-in for new clusters and raise the maximum database size to 20 GB, and GKE is moving its cluster state to Spanner.
That said, even with reduced size of etcd, the K8s project already implemented a few mitigations for cold start performance:
- controller-runtime added a priority queue, where events from the initial list get low priority, so new events don’t wait behind the historical ones (controller-runtime#2374).
- controller-runtime added warm replicas (v0.22), built upstream by a Confluent engineer: standbys start their sources before winning leader election, so a new leader starts with a warm cache. The motivation was our exact problem: “For sources with millions of objects… the initial List+Watch can take tens of minutes” (design doc). As the design notes, this increases the apiserver load, plus wastes memory in the standby.
Both improvements still list all the data: one changes the processing priority, the other does it in advance. As far as we know, there is no K8s enhancement proposal (KEP) for resuming controllers across restarts.
So yes, cold starts in vanilla K8s are a problem, but the smaller size and mitigations made it bearable.
Cold starts on Confluent’s Resource Platform
As mentioned above, our controllers are not using etcd because of the aforementioned capacity limits: in Confluent Cloud we need to hold orders of magnitude more data than the few GBs that etcd is designed for. This is one of the primary reasons that we ended up building our own platform. Since our controllers work like K8s ones, they are designed to list all the resources they watch every time they start, but being able to handle many more resources then posed the question: what would happen if you have a controller that reads the state for all resources and if multiple resources have millions of elements?
This is exactly the bottleneck we hit. Our biggest region alone holds over 25 million objects with over 115 GB of data. This is fourteen times what etcd is meant to hold, and that’s just one region: we have more than a hundred of them, with around 200 million objects in total. And it keeps growing: not every product has moved to the Resource Platform yet, and the platform is a distributed system across clouds and regions, so data also moves between regions. Some controllers watch data aggregated from every region, and before long they will have to start up over hundreds of millions of objects.
Loading this whole set at every startup is a problem for a few reasons:
- Availability. We limit the snapshot throughput on purpose, so a snapshot doesn’t eat the database capacity that live traffic needs. For our biggest region, that means hours.
- Load. Even by limiting the throughput this is taxing for the system, and a mass restart like a rollout or a region failure will hammer the system.
- Memory. The K8s workqueue doesn’t apply backpressure. It deduplicates requests, but still it holds one request per object, which can mean millions of them, on top of everything else the controller keeps in memory.
- Latency. Filling the queue with a lot of historical events will cause head-of-line blocking. New events, like a deletion, wait behind them and the system is lagging behind. This was mitigated by interleaving live events with snapshots, but not always possible: some controllers need to build state from a full snapshot, like in our version of the Garbage Collector. Having a priority queue can help, but only if both live and historical are in the queue.
Before long, controllers processing a lot of resources were slow to start (we even have our own version of the K8s Garbage Collector), and they were using a lot of memory. Even on big nodes with a lot of memory, we ended up going out of memory.
This was not sustainable, and we needed a way to make our controllers resume from where they left off, so we could avoid a cold start on restarts. So we’ve decided to develop the Checkpointing framework.
Checkpointing
What we wanted to do was something as simple as an extra option to the controller builder that would automatically allow controllers to checkpoint their state and restart from it, with teams changing only their configuration and not their implementation:
// rm = resource-manager
err = builder.ControllerManagedBy[rmcctrlutil.Request](mgr).
	Named("widget-ctrl").
	WithApiClientProvider(mgr.GetApiClientProvider()).
	ForResource(&examplev1.Widget{}).       // primary resource -> self-enqueue
	OwnsResource(&configmapv1.ConfigMap{}). // child resource -> owner-enqueue
	WithCheckpointing(checkpointStore).     // <- enables checkpointing
	Complete(ctx, &WidgetReconciler{Client: mgr.GetClient()})
That would basically allow the controller to:
- Save the state periodically (with a configurable interval)
- Resume the state at startup
But, how can we do that? This is a grocery list of what we need to resume a controller:
- We need a way to resume the watch stream from where we left off, the position in the stream.
- We need to know if there is any leftover work from the moment that we’ve recorded the position in the stream.
- We need to save any extra state with the position in the stream.
- We need to be sure that we can guarantee at-least-once delivery.
Resume the stream
Our custom watch API has an important feature: Continue Tokens (not to be confused with the K8s continue token, which pages through a LIST).
A continue token is just an opaque string sent on each watch event. It can be sent in a watch request to restart the stream from exactly the point of the event. K8s has a similar concept with the resourceVersion, with a big difference: a resourceVersion is only valid for a short period of time (by default 5 minutes in K8s), and it’s mainly used to resume a watch after a disconnect. Our continue tokens are long-lived (~1 week), so we can use them across a full controller restart.
The watch protocol in our platform is used as a standalone feature and not just by controllers, so we always had to provide a way to resume the watch where you left off, like an Apache Kafka® offset. We do know a thing or two about Kafka after all! And of course, we use Kafka under the hood.
So, all we need is to keep track of this token for the controller watch.
The ResumableSource
The resumable source is just a custom implementation of the controller-runtime source (we delegate to the same interface) which extends it with methods to be able to snapshot current tokens for the stream, and to resume a stream with a set of tokens: To be able to checkpoint a source, we need it to be resumable.
type ResumableSource[R comparable] interface {
	// the K8s upstream interface — Start + WaitForSync
	// sigs.k8s.io/controller-runtime/pkg/source
	source.TypedSyncingSource[R]
	GetName() string
	// To resume the source
	Resume(token *continuetoken.WatchingSourceResumableState)
	// To get all the tokens, this is an immutable Map<kind, Token>
	CheckpointTokens() *continuetoken.WatchingSourceResumableState
	// Which kinds are active for this source
	ActiveKinds() []schema.GroupKind
}
A source can watch many kinds and dynamically change what it watches, so the state is a map of GroupKind to token, and ActiveKinds tells us which kinds the source is currently watching, so we only keep tokens for those and we discard tokens for kinds that are now unwatched, or deleted.
When we resume, the source passes the token back to the watch API, and the stream starts again from that position, instead of from a full snapshot.
Track leftover work
Restarting the stream is simple, but alone it does not guarantee correctness: Events can add 0..N objects on the queue, the queue is processed from N goroutines in parallel. You cannot be sure when all requests generated from a source event are processed by the pipeline.
In short we need to be able to track what is inside the controller queue, but how does that actually work?
The queue is really just a queue data structure, which processes reconcile.Request, which is the identifier used to fetch the latest status of the object. Readers familiar with Kafka are used to processing full events: that’s edge-triggered, you react to each change. In K8s, an object change triggers a reconciliation request, the reconciler will fetch the current state and bring it to the desired state: that’s level-triggered.
This is good news for checkpointing: a request is small, so we don’t need to store any event data. But we need all of them, or we lose work.
We need to track all reconcile.Request inside the queue:
- Queue data structures usually do not have a getAll() method, and the K8s one is no exception
- The client-go workqueue does not have just a queue, but 3 more data structures:
- The delay heap: It is a heap that is used to track objects that need to be reconciled at a later time. A timer picks them and adds them into the queue.
- The dirty and processing sets: These are used for deduplication and to maintain the invariant that the same object is reconciled only from a single worker at all times.
We needed an extended version of the queue that could:
- Return efficiently all the requests that still need a reconciliation: items in the queue, items being processed and items on the delay heap
- Be initialized with a set of requests at startup
The Tracking Queue
In the same way that we’ve created a wrapper for sources, we needed a custom queue that could track all that we need for a checkpoint.
The K8s queue is a stack of layers, and client-go lets you build it yourself, so we put our tracking core right above the innermost layer, and a TrackingQueue wrapper on top:
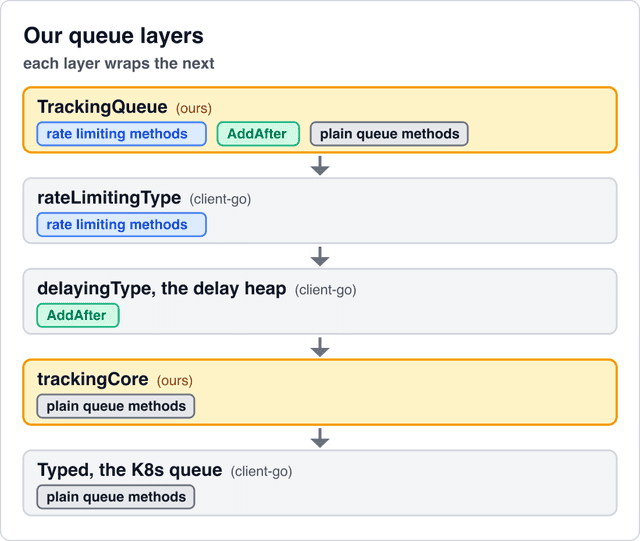
As you can see in the image, the delay heap, the rate limiting and the K8s queue are still the ones from client-go. TrackingQueue wraps the whole queue interface, and the tracking core sits below the delay heap. Every request that enters the K8s queue passes through the tracking core, including the ones coming out of the delay heap. Since the core cannot see an item while it waits in the heap, TrackingQueue marks an item as delayed when AddAfter or AddRateLimited is called, before it goes into the delay heap. We could not track everything with a single wrapper on the outside: Get has to take an item and mark it as processing in one step, and from outside an Add can slip in between.
// the public wrapper used from checkpointing
type TrackingQueue[T comparable] struct {
	// the whole stack below: rate limiting -> delaying -> core -> K8s queue
	workqueue.TypedRateLimitingInterface[T]
	// the same core, used to mark delayed items and to read the unfinished ones for a checkpoint
	core *trackingCore[T]
}

// trackingCore holds the state
type trackingCore[T comparable] struct {
	delegate workqueue.TypedInterface[T] // the K8s queue
	mu       sync.Mutex
	items    map[T]itemState // dirty | processing | delayed: in the map = unfinished
}
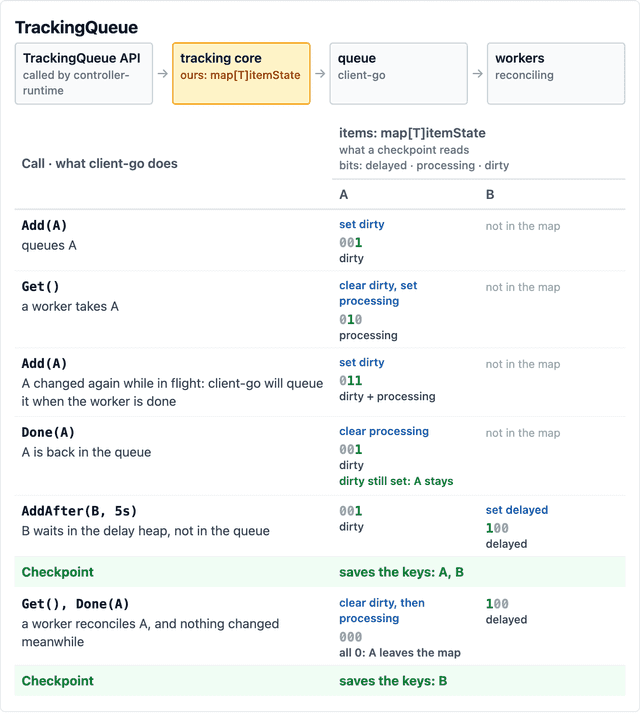
In the same way that K8s tracks objects in flight and in heap via different data structures, we do the same, but more compact compared to three separate sets: We use a single map with a bitmask to know the status of each element:
type itemState uint8

const (
	stateDirty itemState = 1 << iota
	stateProcessing
	stateDelayed
)

// itemState holds an item's independent flags as bits, so an item can be in any combination of them.
//      bits  state                meaning
//      ----  -------------------  ----------------------------------
//      000   (not in the map)     nothing left to do
//      001   dirty                in the queue, waiting for a worker
//      010   processing           a worker is reconciling it
//      011   dirty + processing   changed while a worker was reconciling it: re-queued on Done
//      100   delayed              waiting in the delay heap
Overall, what we do is to be sure that we keep track of all items at all times. Since this is quite tricky, it was tested with property-based tests and a state machine: we run randomized sequences of operations and ensure that every item that still needs a reconcile is always tracked, but we have one known gap. If an item has an entry waiting in the delay heap and is also added on the queue, a worker can get it, which clears its delayed flag while the heap entry is still pending. Once the object is processed, if the controller does not add it back to the delay heap with AddAfter() or AddRateLimited(), the checkpoint will not include this entry even if in the heap. We consider this safe for a level-triggered controller: if the reconciler just reconciled such an object and concluded that we don’t have to delay the processing, the delayed processing is not needed anymore.
An extra feature we get from the TrackingQueue is that we can see delayed items as well, which are not exposed from standard K8s metrics.
The following image shows how TrackingQueue proxies the queue operations, and keeps track of objects:
Save any extra state
So far, we know how to restart a source, and we are tracking what’s in the queue, but what if my controller is keeping some in-memory state? An example is our version of K8s Garbage Collector: We keep an in-memory graph that we need to flush along with the checkpoint. So we provided an option to provide a Checkpointable object, which is stored in the additional state: In our case it is a reference to a blob storage URI.
type Checkpointable interface {
	// Name returns a unique identifier for this component within the controller's checkpoint.
	Name() string
	// Checkpoint serializes this component's state into the writer.
	Checkpoint(ctx context.Context, writer io.WriteCloser) error
	// RestoreCheckpoint deserializes this component's state from the reader.
	RestoreCheckpoint(ctx context.Context, reader io.ReadCloser) error
}
Guarantee at-least-once delivery
This is the hardest challenge of all the checkpointing work. We know we have to track tokens, requests in the queue and additional state.
What we know:
- Events from the source are processed sequentially for each watch stream. Each watch stream is for one kind only.
- Tokens can be stored only after the event has been processed from the handler. The handler adds requests in the queue, so if the handler code is executed, we are guaranteed that requests are in the queue.
- If we store the queue along with the token, we might reprocess events, but never lose them.
If we were to lock on event processing the order wouldn’t really matter: We could acquire the lock, so we are sure no token could advance, save the queue, save state and token. The queue can keep processing in the meantime but we need to stop the token advancing. Even if acceptable, doing a full checkpoint can take quite some time, e.g. we currently have a big external state which takes seconds to be stored, we don’t want to stop sources for such a long time. Plus, having locking mechanics is complicated and error prone: we need to ensure no deadlocks and might need to span across multiple components.
But since we don’t want to lock, all three elements: the tokens, the requests in the queue and additional state are a snapshot in a different moment in time: The order in which we take them is what gives us at-least-once delivery.
Tokens are always taken first. A token only moves forward after the handler has processed the event, so every event before the token already has its requests in the queue. When we snapshot the queue right after, those requests are either still there, so they end up in the checkpoint, or they’ve already been reconciled. The queue snapshot can be ahead of the tokens, never behind them. The same goes for the additional state: we collect it after the token. At worst, they get reprocessed, hence “at-least-once delivery”.
Let’s reverse the order: Say we snapshot the queue first. Then a new event arrives, the handler enqueues a request and the token moves forward. Then we snapshot the token. Now the checkpoint has a token for a request that is not in the queue checkpoint. If the controller restarts before reconciling it, that request is lost.
The following image shows it:
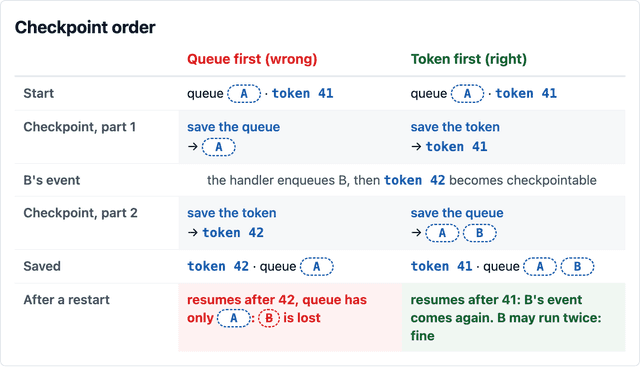
Reprocessing is fine because controllers are level-triggered: a request is just a name, and the reconciler always reads the latest state, and needs to be idempotent (see the Track leftover work section).
We don’t actually preserve the delay value for elements in the delay heap when storing them, and when we restart they are processed straight away, we could add the delay/retry info for requests in the checkpoint, but for now it is not worth it. A controller already has to handle this: if something changes for that object, it gets reconciled straight away anyway, delay or not. The only side effect is that retry backoff is reset, so items that were failing will all retry at once after a restart, but as we said, reprocessing is fine. That is only because the queue in a checkpoint is kept small: we don’t write a checkpoint above a maximum size, as explained in Final shape, otherwise we would risk having the same cold start problem when starting from a checkpoint.
Final shape
Now that we saw all the moving parts, and the order of operation, we can see how the checkpointing works at a high level.
We showed initially that we only wanted a new option on the controller builder: .WithCheckpointing()
If the option is provided, the controller will resume the checkpoint on Start(), before the controller starts, and periodically checkpoint while running.
At Resume:
- Loads the checkpoint
- Restores the checkpointable
- Initializes the queue with reconcile.Request
- Resumes watch from tokens
At Checkpoint:
- Snapshot tokens
- Snapshot unfinished requests from the TrackingQueue
- Collect any additional state
- Write checkpoint
If you are familiar with K8s, you might be asking: What happens to informer caches? Well, in our system we don’t have informer caches by default in controllers as K8s does (another side effect of having to support more data). We still have an informer cache component, but it is decoupled from the controllers with its own lifecycle.
This is the timeline:
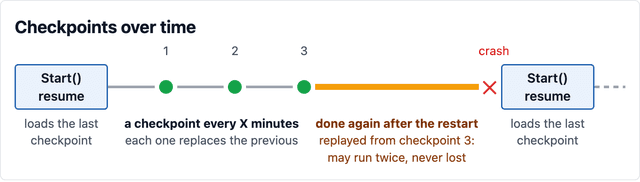
So, we know that we need to store the tokens, and the objects in the queue, but we’ve added some extra checks.
There are scenarios that might make us skip a checkpoint, an example would be when the queue is filled with too many objects (current limit is 15k). During a snapshot phase, when controllers are cold starting the first time with no checkpoint, or if there is a flood of events, like a mass deletion, the queue can have > 5M elements, and a checkpoint would end up storing a lot of data and would be very inefficient.
We included a check for a configurable maximum number of elements we are willing to store. If the number of elements exceeds this budget, the checkpointing is skipped and we wait for the queue to drain: For our use case, we are okay in delaying the checkpoint to the next cycle, or even a few hours.
If the controller crashes before the queue drains, it starts again from the previous checkpoint. If checkpointing keeps failing, the controller keeps restarting from the last good checkpoint, until the tokens expire (they are kept for about a week) and it falls back to a full snapshot. The framework exposes metrics, so you can monitor whether checkpointing is failing, and why. We assume that one week should be enough to sort out any issues.
Results
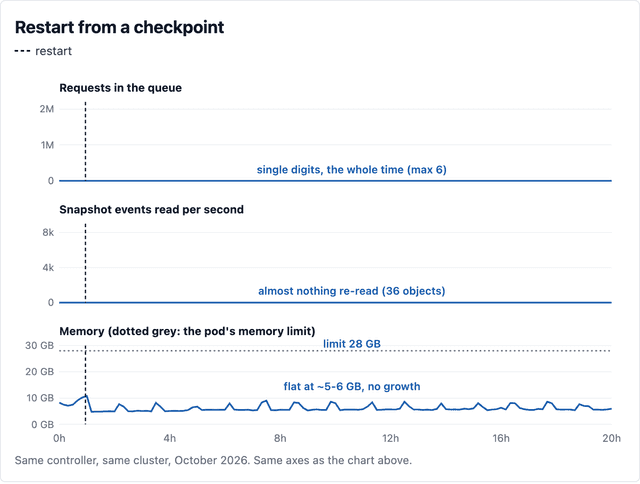
In our biggest region, a full snapshot means reading over 25 million objects, over 115 GB of data. Since we deliberately limit the snapshot throughput to protect our database capacity, starting a big controller took around 6 hours. With checkpointing, a restart only reads what changed since the last checkpoint, and the same service is back running in about 1 minute.
Across the platform, we went from 210M snapshot events per week to 34M, about 6x fewer, while the number of objects kept growing. The database reads themselves were relatively cheap, so we didn’t save a ton of money there (roughly ten thousand dollars a year), but there are more important side effects:
When pods are evicted, we are back online in 1 minute instead of hours, which makes stricter SLOs possible. The actual checkpoint resumes in less than a second: only the latency to read a checkpoint and restart the streams. The rest is the service starting up.
Every unnecessary reconciliation is not just the KBs read from the DB and delivered over the network: a reconciler is usually doing several API requests, fetching data from databases, and so on. All of this was consuming CPU and memory, and a cold start could trigger millions of these operations at once, with an avalanche effect on the services downstream. Now a restart only reconciles what changed or was still in the queue.
We are now even more scalable: We can handle cold restart, no matter how many objects we have.
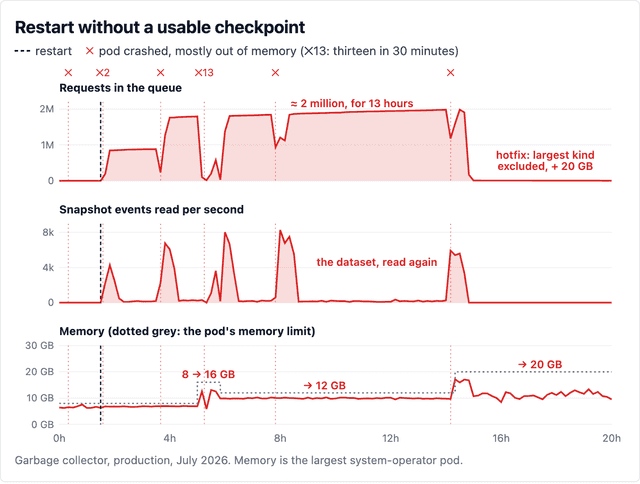
We have some real numbers to show. In July we had a bug in the checkpointing framework and some tokens were dropped, so we had to restart from a partial snapshot of the data. That didn’t go well, because our biggest kind was one that lost its token. The pod got stuck for hours and kept crashing, and we had to manually increase the memory on the deployment and exclude the biggest kind to get the pod into a ready state. Because of this, our system controllers (the Garbage Collector among them) weren’t running, which left some Apache Flink® statements stuck in deletion.
These graphs were built for this blog post with Python, but the data comes from our production metrics: you can see the difference between when we couldn’t load a checkpoint (and did only a partial snapshot) and when we used a checkpoint.
Conclusion
We built a checkpointing framework that can be used with K8s-style controllers, to avoid pulling all the data during a cold start. The main challenge was to guarantee at-least-once delivery semantics over the K8s controller pattern, plus having to work with the K8s interface and maintain compatibility with it.
The code is specific to our platform, but the problem isn’t. A controller is a stream processor: it handles events asynchronously and concurrently, and we know a thing or two about Apache Flink® too. To restore it, you need two things: the position in the stream, and the work still in flight. Take them in the right order, and you can resume instead of starting from scratch.
Checkpointing has been running in production for a few months now. We use it for all our system controllers, and many product teams at Confluent use it for their own controllers.