How we cut Flink OOMKills by 91.2%: Zombie block cache, phantom CPUs (and some bonus AI Learnings)
Two months after joining Confluent on the Apache Flink team, I was asked if I’d like to investigate and fix Out-of-Memory kill events (OOMKills). OOMKills are a particularly disruptive failure mode for streaming workloads: the Flink Task Manager is terminated by the kernel, in-flight work is lost and the Flink job must recover from its last checkpoint, taking precious seconds. Diagnosing OOMKills is not straightforward because they are a symptom of many possible causes, e.g. leaks, fragmentation, misconfiguration. An impactful and difficult project this early into a new job? I bit immediately, perhaps a bit too naively, not knowing how deep and lengthy it would get. By fixing native-memory leaks and jemalloc fragmentation in Flink's use of RocksDB, we cut OOMKilled Task Managers by 91.2%, and reduced peak memory usage by 13%.
Closing the diagnostic loop
Early in the project we identified a gap in how we diagnose OOMKills. Flink container OOMKills are usually caused by excessive native memory usage but common JVM tools such as Java Flight Recorder or async-profiler primarily profile Java heap and not native memory. Closing that gap meant enabling profiling on Flink's native memory allocator jemalloc which carries runtime overhead. So by design, jemalloc profiling is disabled and related tooling is not bundled in our production Flink Docker images. The tradeoff was sound for steady-state operation, but it made ad-hoc investigation expensive. Capturing a profile meant patching, waiting on a CI pipeline, and migrating the target job, taking roughly a day of turnaround before any data could be collected. In practice, that put jemalloc profiling out of reach for on-call engineers already triaging live incidents.
We closed the gap on two fronts. First, we extended the CI pipeline to build and publish profiling-capable Flink images alongside every base Flink image, so the tooling is always available on demand with no rebuild. Second, we streamlined the operational tooling so that migrating a job to the profiling image and capturing a jemalloc profile takes a couple of minutes and a few clicks. The same tooling automatically captures and uploads information from any OOMKilled job, so the evidence is available when an engineer begins to investigate.
If you’re curious, here’s how we enabled profiling. See the jemalloc profiling wiki for more details:
# Enabling heap profiling: prof:true
# Report memory still live at shutdown: prof_leak:true
# Dump a profile every 2^26 bytes (64 MiB) of allocation: lg_prof_interval:26
# Sample once per 2^16 bytes (64 KiB) of allocation: lg_prof_sample:16
# Path for dump files: prof_prefix:prof_prefix:/tmp/example/jeprof/prof
MALLOC_CONF=prof:true,prof_leak:true,lg_prof_interval:26,lg_prof_sample:16,prof_prefix:/tmp/example/jeprof/prof
The Zombie Block Cache
With the improved tooling, we were able to capture jemalloc heap profiles in frequently OOMKilled Flink jobs. An interesting profile emerged where we saw 7.28GB allocated to RocksDB block cache via BlockFetcher::ReadBlockContents.
bash-5.3$ jeprof --text --cum ... /tmp/jeprof/...heap 2>/dev/null
Total: 9738.4 MB
    0.0   0.0%  96.9%   7461.9  76.6% rocksdb::BlockFetcher::ReadBlockContents
    ...
    0.0   0.0%  96.9%   3252.7  33.4% rocksdb::MergingIterator::Seek
    ...
    0.0   0.0%  96.9%   2482.2  25.5% Java_org_rocksdb_RocksDB_createColumnFamilyWithImport
    ...
This was more than twice the configured capacity of 3.25GB! Flink’s RocksDB block-cache-usage metric was also reporting exactly 3.25GB of usage. Knowing that jemalloc profiling uses sampling to construct a statistical representation of the heap profile made me suspect that the heap profile might be skewed and inaccurate. Process memory usage (anon RSS), however, was showing a few GBs of additional unexpected memory usage, indirectly supporting excessive block cache usage. It is only a circumstantial metric at best, as anon RSS may also include unrelated usage, e.g. memory fragmentation.
To confirm the validity of the profile, jemalloc was configured to sample often and minimize memory fragmentation. The heap profiles were still showing excessive block cache usage and malloc_stats ruled out memory fragmentation as there was effectively none. This gave me the confidence that the jemalloc profile captured a memory leak invisible through Flink.
I have the luxury of working with some of the folks who have deep Flink knowledge, including many of the committers to the project. After consulting them, experiments were run and a couple of other possible root causes such as excessive memory usage from iterators and the use-ingest-db-restore-mode feature were ruled out.
The leak, active when the manual-compaction feature is enabled, was eventually traced to an unclosed ColumnFamilyOptions wrapper in the Compactor class on the Java side. An unclosed ColumnFamilyOptions causes two leaks:
- ColumnFamilyOptions native object leak. Even when the Java side wrapper is garbage collected, the small native object lives on.
- The native object transitively holds a reference to the shared block cache. When all tasks are stopped, the Task Manager attempts to free the shared block cache, but the shared block cache cannot be freed on the native side as the unclosed ColumnFamilyOptions holds a reference to it.
On Task Managers running only one job, a job restart leaks the entire shared block cache! Even worse, RocksDB metrics are derived from the latest created cache, making the leaked old cache invisible; this was why the bug survived earlier scrutiny.
The fix has been successfully deployed and reduced the number of Task Managers running into OOMKill by 64.9%, improving Flink jobs' availability and reducing on-call workload. See FLINK-39753 for more detail on the issue and fix.
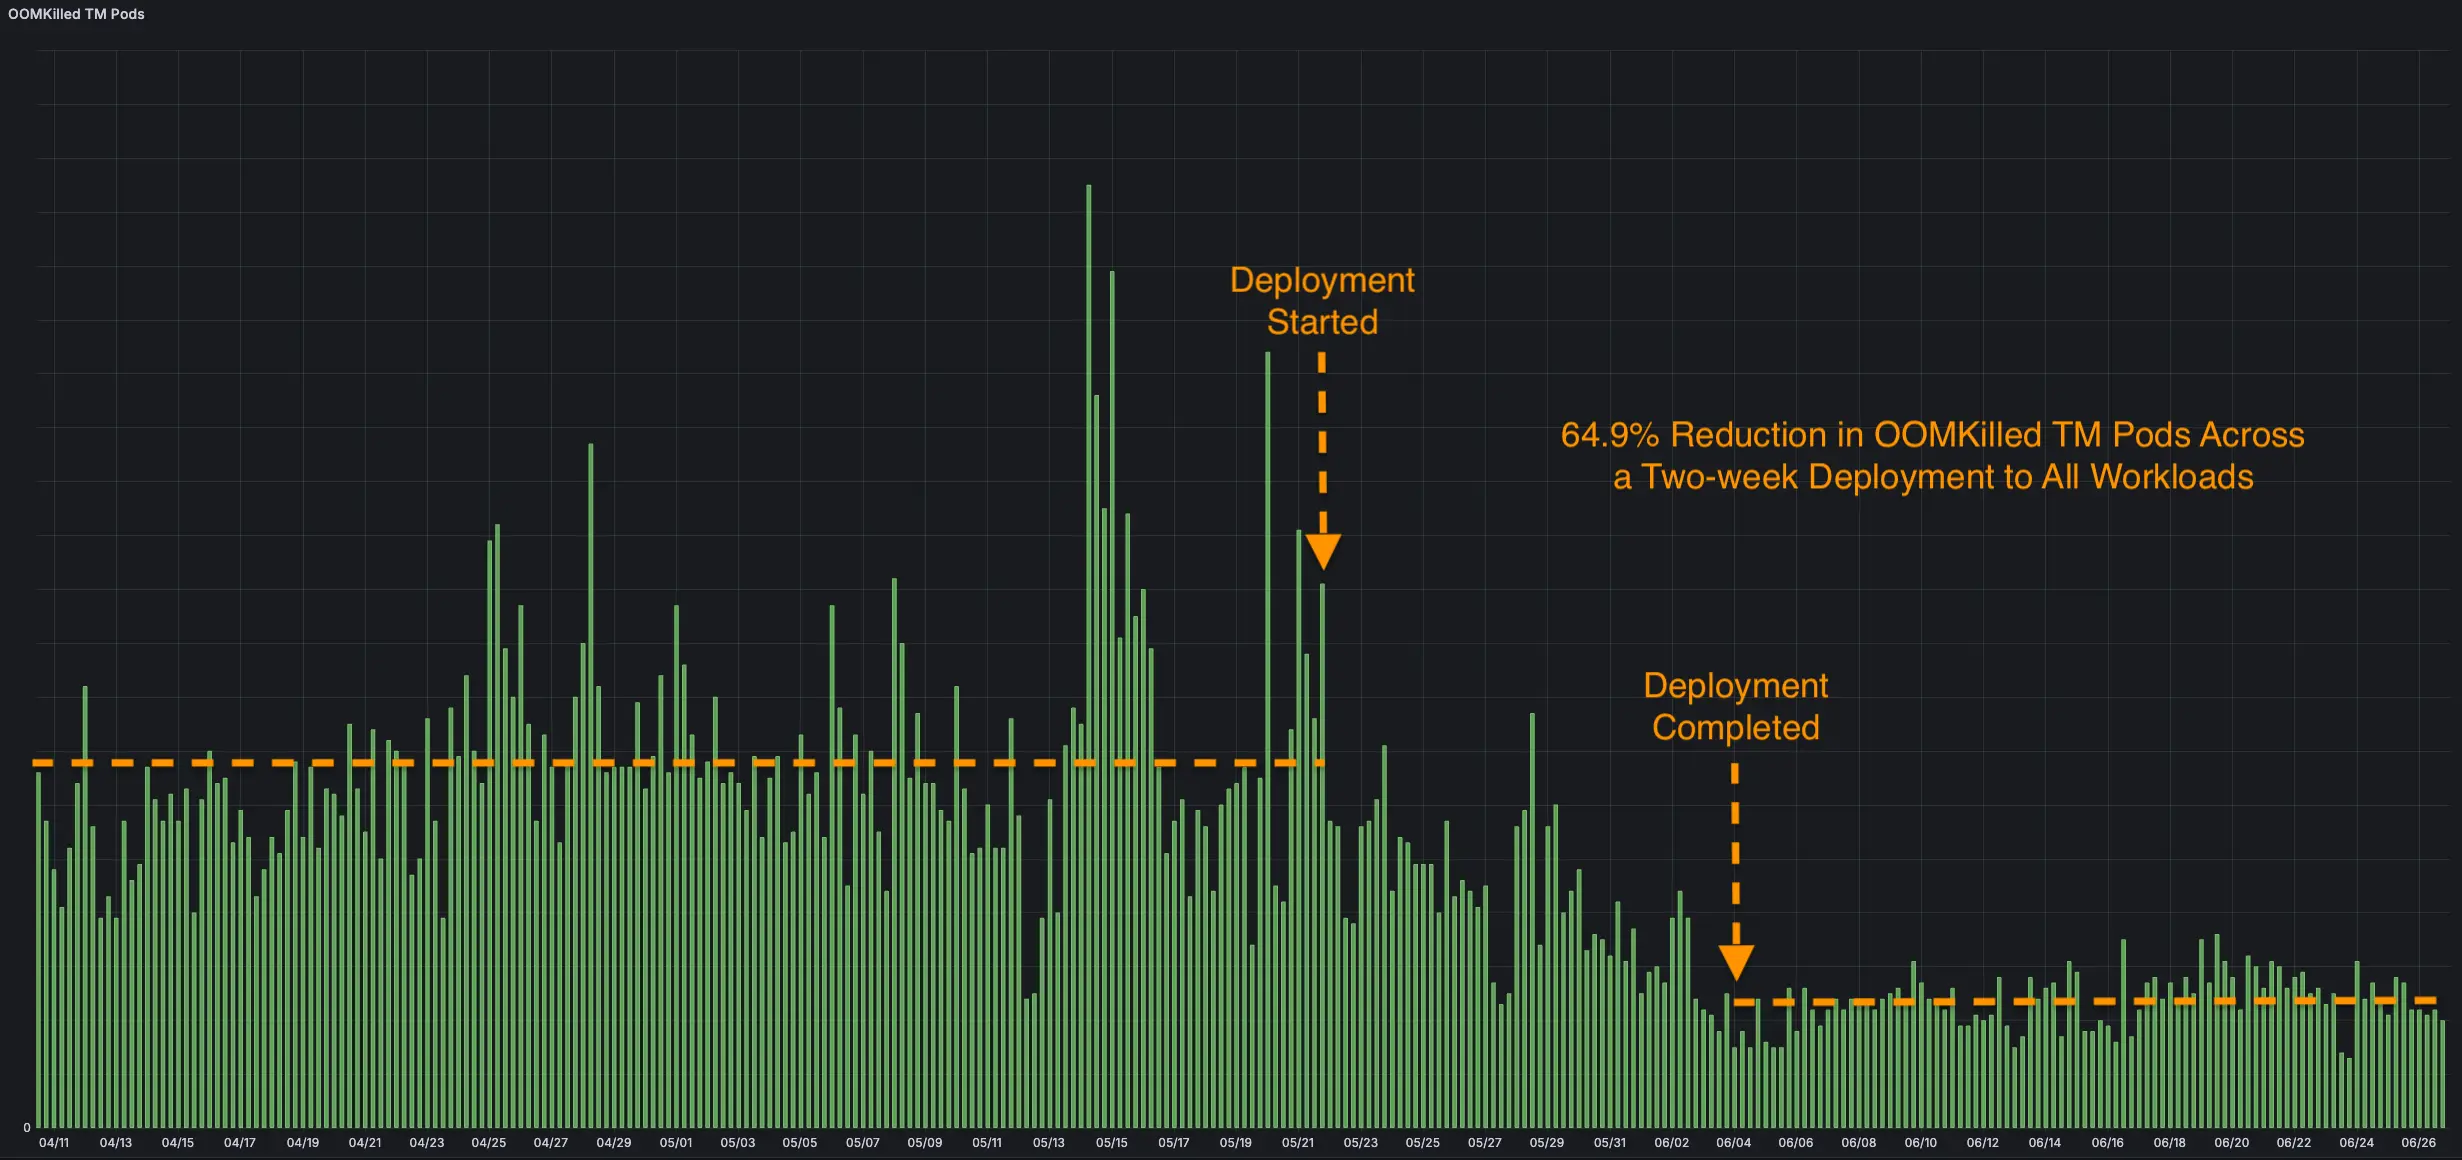 64.9% reduction in OOMKilled TM pods across a two-week deployment to all workloads
The Phantom CPU
So that was one issue fixed! But my work wasn’t finished yet. The leak was one source of memory pressure; fragmentation turned out to be another. In some malloc_stats output from tooling, we saw direct evidence of external fragmentation. In the most extreme case, large external fragmentation taking up almost 25% was found.
To explain fragmentation, here’s a quick overview on how jemalloc works. jemalloc uses small per-thread caches (tcache) and many-thread-to-1 caches (arena) to minimize thread contention and expensive OS operations. When a thread frees memory, the memory is placed into tcache. If tcache is full, the memory is moved into an arena. When in an arena, memory either gets reused and put into tcache or released to the OS after 10 seconds in a mechanism called dirty decay. Large external fragmentation happens when a large amount of memory is held in arenas.
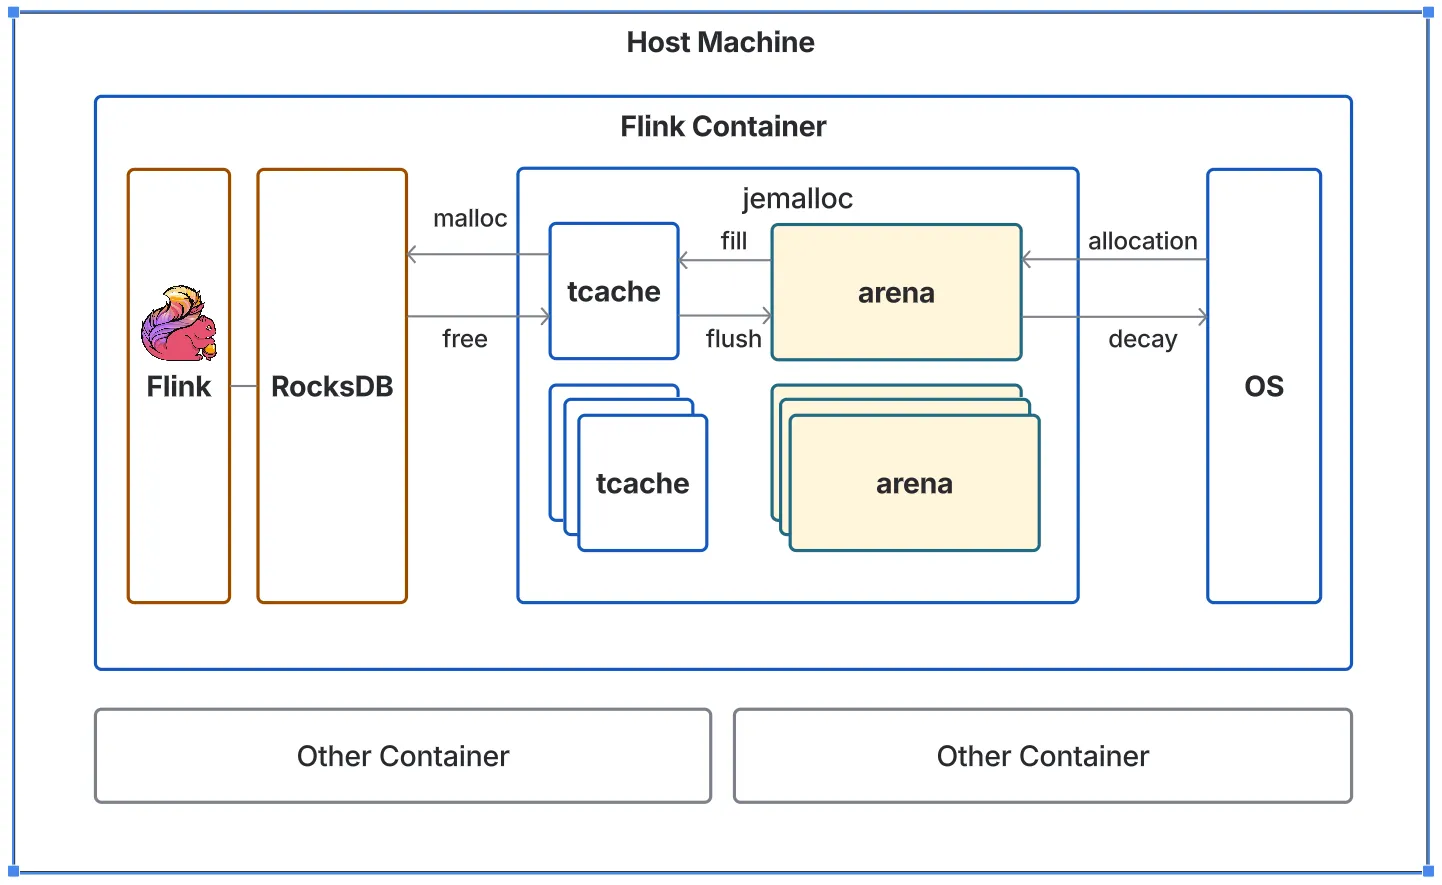
So what can we change to reduce fragmentation? The obvious action to take was to reduce jemalloc narenas to reduce the arena count or reduce dirty_decay_ms to return memory to the OS quicker. However malloc_stats revealed that the number of arenas was much higher than the default of 4 * CPU core count. The root cause was interesting: jemalloc is not container-aware and when it configures narenas, it uses the number of CPU cores of the host machine instead of the container. The resulting larger number of arenas meant most are infrequently used and therefore contribute to external fragmentation.
We updated Flink so that it configures jemalloc narenas using cgroup container's CPU count (see FLINK-39924). Under a load test designed to maximize RocksDB state access, this update reduced peak Task Manager memory usage by up to 13%. This matters for OOMKills because jemalloc's native memory fragmentation isn't tracked by Flink's own memory accounting, it consumes whatever margin is reserved for jvm-overhead and off-heap memory. With the updated configuration, the measured 13% reduction exceeds the combined reserved margins of 7.3% jvm-overhead and 3.1% off-heap (native overhead). The peak memory usage also became more predictable, hovering around 70% despite heavy reads, writes, compaction and checkpointing. This is in contrast to the unpatched cluster where peak memory usage is higher and fluctuates greatly.
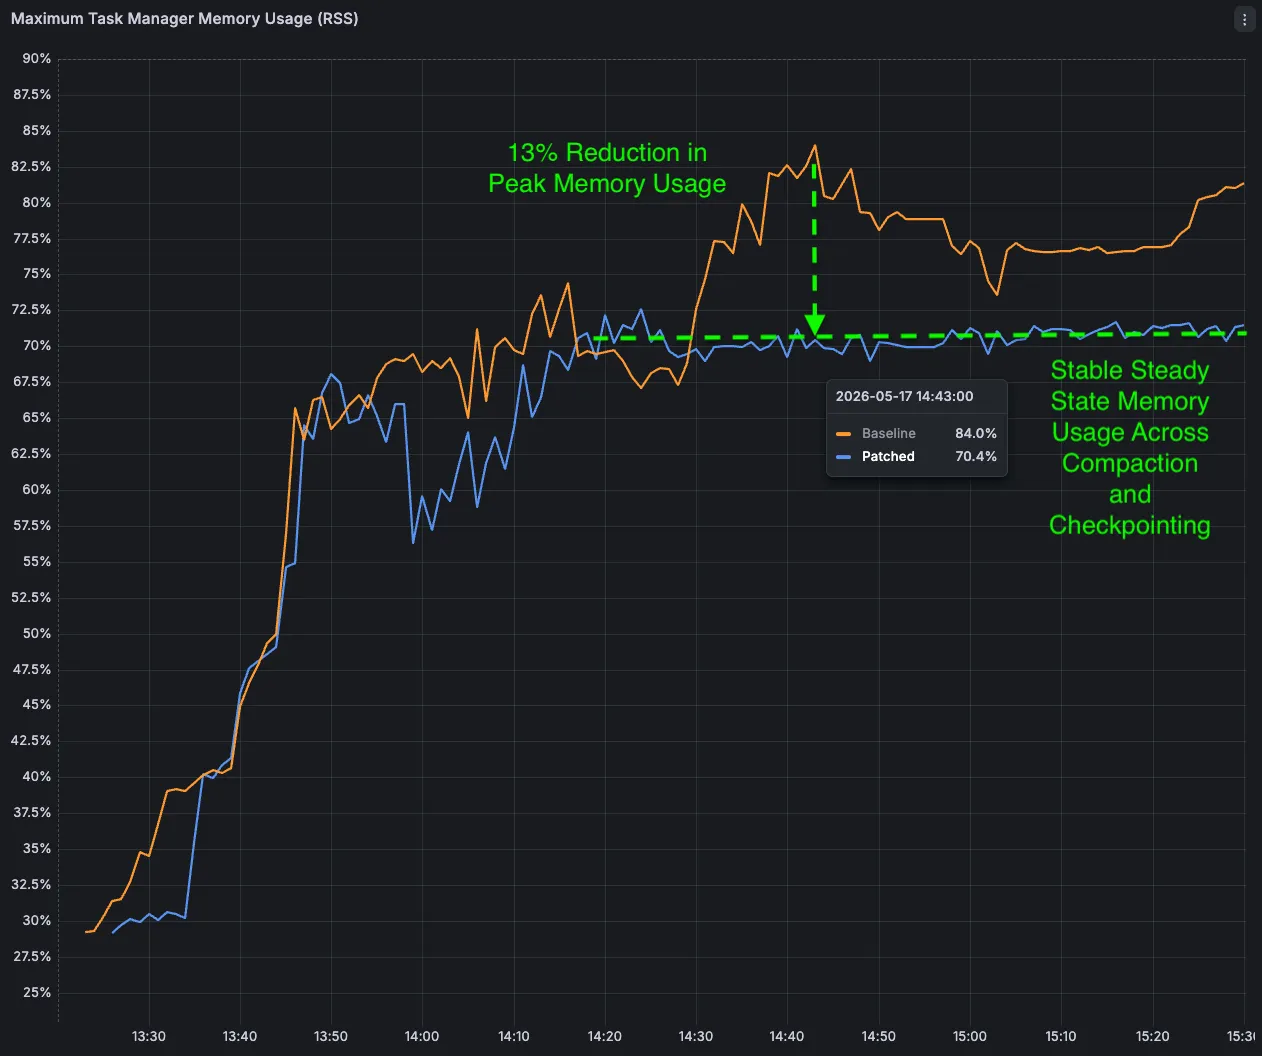 13% reduction in peak memory usage after jemalloc narenas configuration change
The Dormant Leak
As well as the two key issues above, I found OOMKills from SinkUpsertMaterializer, which will be fixed by FLIP-544, and a RocksDB Statistics object leak FLINK-39923.
The Statistics object leak is similar in shape to the block cache leak where a native object never gets explicitly closed, and the leak compounds with every job restart. When any of RocksDB's 11 ticker-type metrics (e.g. block-cache-hit, bytes-written) are enabled, each keyed state backend rebuild allocates a new native Statistics object that is never released. The bug had been latent since FLINK-24786 introduced the Statistics object without an explicit close(), relying on the JVM's finalize() to eventually call dispose() on it. That safety net disappeared when Flink 2.0+ upgraded to frocksdb 8.10.0 (a custom fork of RocksDB containing several optimizations specific to Flink), where native finalizers are dropped, turning a latent bug into an active leak. The fix makes RocksDBNativeMetricMonitor.close() explicitly close the Statistics object instead of just dropping the reference. Fixing the leak has led to an additional 74.9% reduction in the remaining OOMKilled Task Managers.
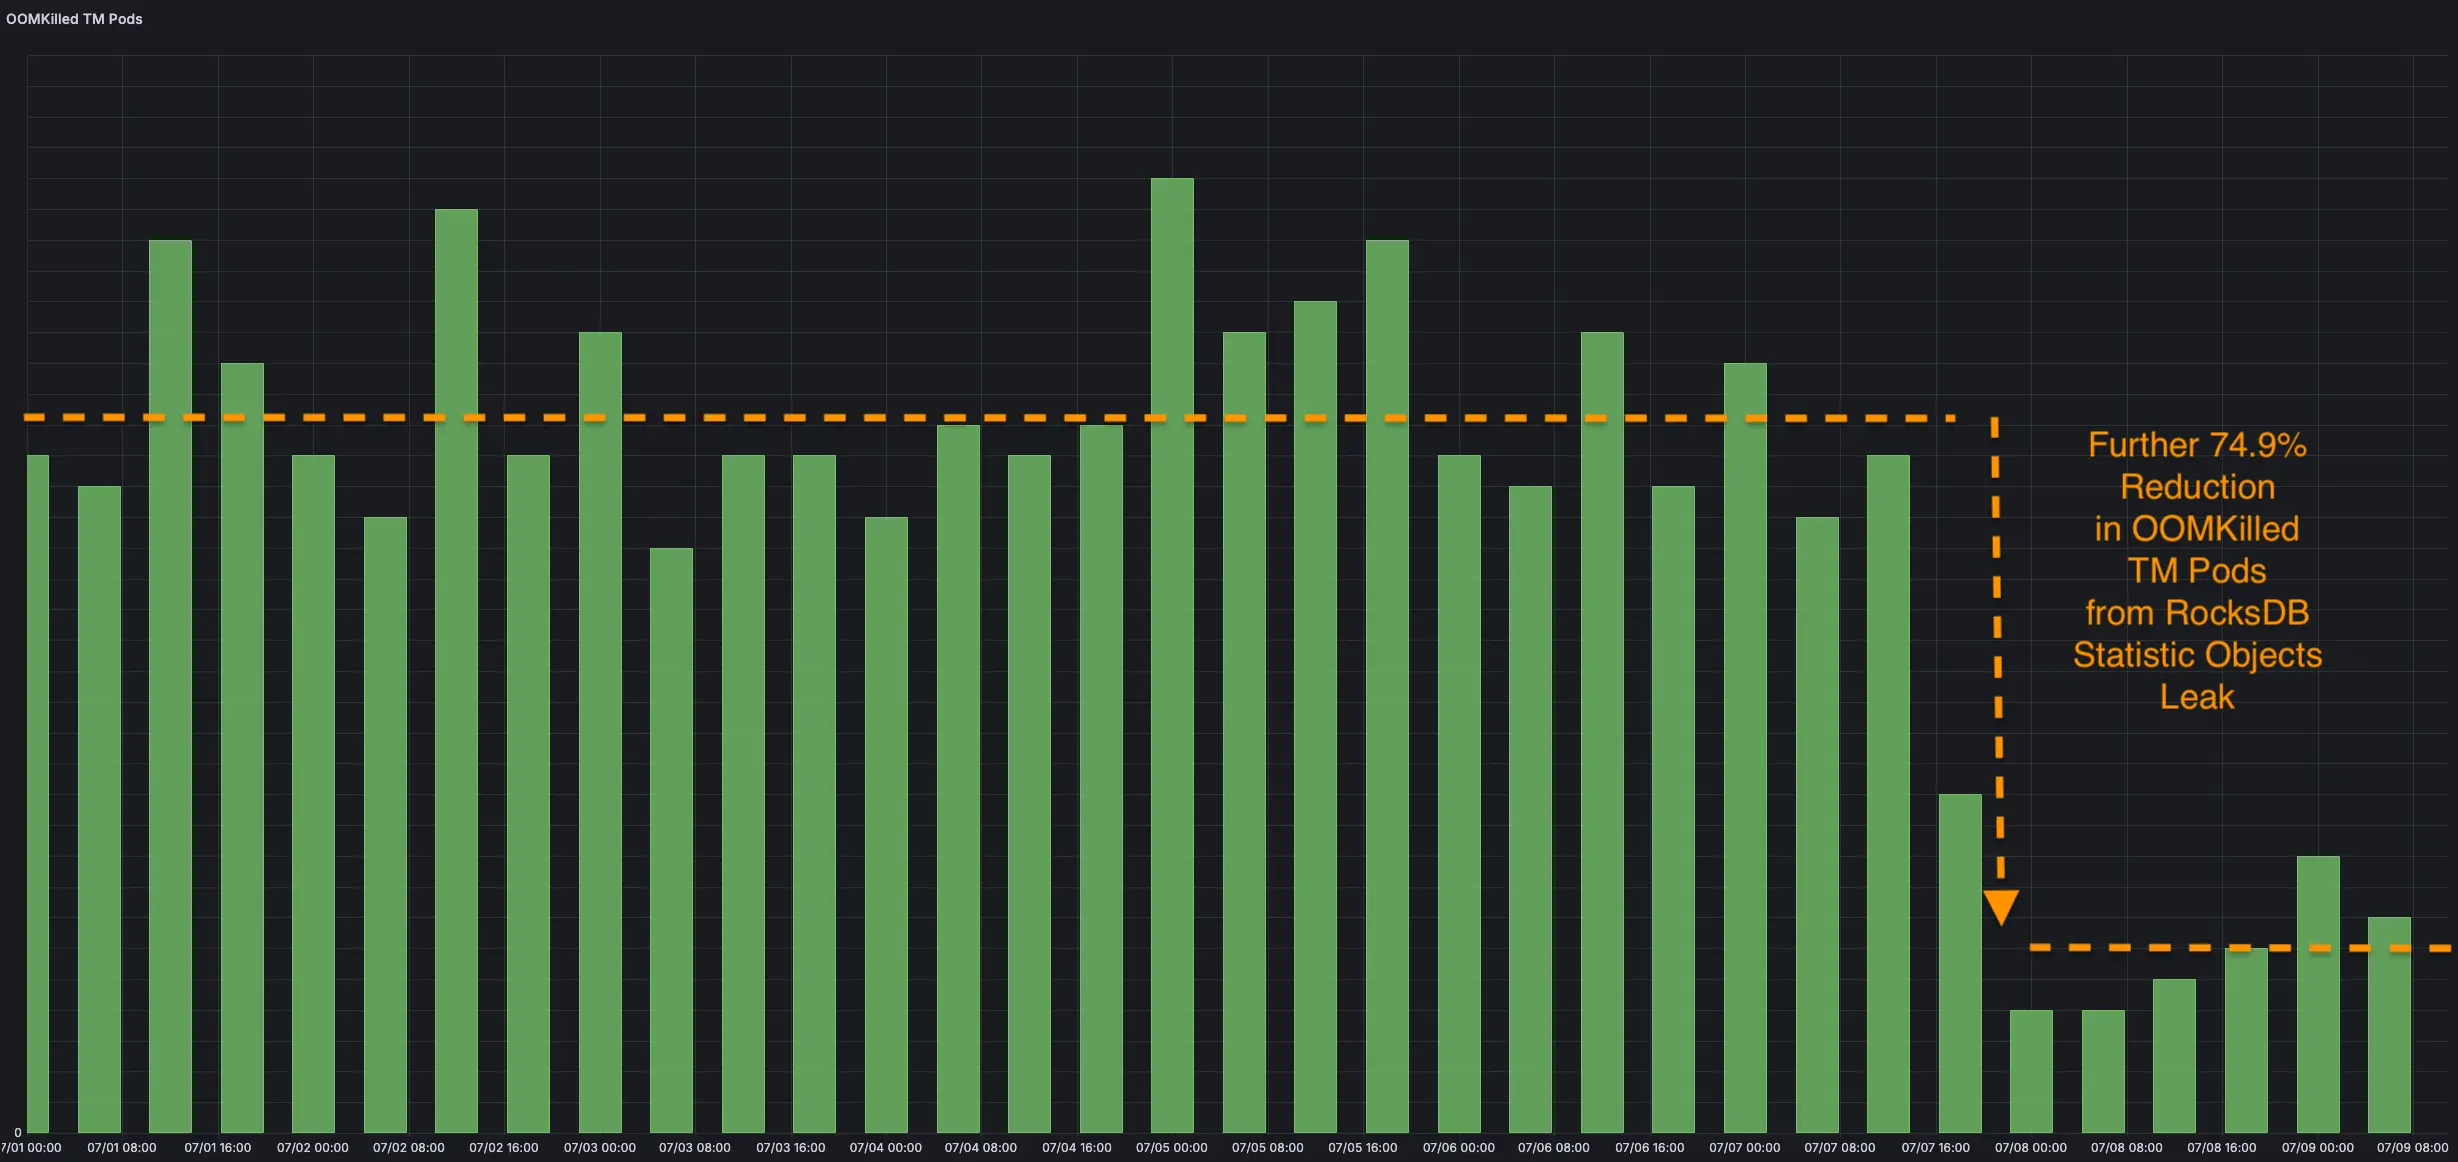 74.9% reduction in OOMKilled TM pods after RocksDB statistic objects leak fix was deployed
Assistant to the Software Engineer
Running a complex investigation with Claude is a bit like working with Dwight Schrute. Claude is eager, tireless and remarkably capable in the right role, just not the one to leave in charge of a complex investigation.
Build a skill first—then distill into a harness
Claude (Opus 4.7) was very useful in making improvements to our operational tooling, running and instrumenting repeatable experiments through skills. As an example, I ran probably more than 30 experiments. These experiments were run in a pre-production environment where service components are updated often, may break and interrupt the orchestration of an experiment. Without Claude, I’d have had to spend weeks building a robust test harness to run these experiments.
With Claude, it only took a couple of hours to create a repeatable skill by first guiding it through the most basic steps of running an experiment. On each run, the skill parses a template .sql file and generates DDL and DQL .sql files for control and experimental groups. It then uses my Confluent CLI session to create compute pools, Kafka clusters, topics, and both the subject statements and synthetic data generation statements. Finally, it builds a per-experiment Grafana dashboard from a template and populates it with information such as experiment setup and tested variables, providing a one-page view that visualizes variables' impact on memory utilization, OOMKill restart count, throughput, etc. You might say running a Claude skill is more expensive than running a test harness. That may be true in some cases, but in this scenario we do not have full information on the variables and levers that are needed (synthetic data schema, synthetic data rate, SQL statement, Flink image, Flink configuration, pod resources, host node size etc.) and transient or prolonged errors occur. Claude helps here because it can respond to changes in a way that a traditional test harness could not without lengthy updates. Evolving the skill to accommodate additional requirements was a straightforward text file change.
Additionally, a test harness and skills are not mutually exclusive; I believe the best way to build a robust harness or any workflow is to first create, use and iteratively improve a skill before distilling the skill into a harness.
Keep Claude methodically rigorous
On the flip side, Claude is more goal-oriented than methodically rigorous. This is problematic for complex investigations. It will take shortcuts, build theories on assumptions, and present them as findings. When Claude couldn't find jeprof to parse a jemalloc heap profile, it wrote its own parser instead, misread the output by one line, and confidently reported that a benign library was the memory hog. A human who can't find jeprof usually just installs it.
Both behaviors come from the same place: Claude optimizes for reaching an answer over the integrity of the path to it. The antidote is to make Claude build from first principles rather than reason backward from a goal. When pointed at the Flink repo and asked to find the root cause of FLINK-39923, it failed. Asked instead to first rule out a leak in RocksDB, then work up through the JNI layer, then into Flink, it found the cause in under 30 minutes. Its weakness, conveniently, is also a standing invitation to practice being a rigorous engineer.
Wrapping up
What I took on (perhaps too eagerly!) turned into a far deeper dive than anticipated through RocksDB, jemalloc and Flink’s native memory before delivering a significant reduction in OOMKilled Task Managers in production.
We tracked down, fixed and upstreamed fixes for leaked block cache (FLINK-39753), memory fragmentation from jemalloc misconfiguration (FLINK-39924) and a RocksDB Statistics object leak (FLINK-39923) where the fixes have reduced OOMKilled Task Managers by 91.2%.
Finally, this project has given me a few takeaways for future complex investigation. Invest in a diagnostic loop early; the tooling we built ended up paying for itself many times over. Trust but always verify our instrumentation; the memory leaks were hidden because Flink’s metrics reported healthy numbers. We lean on AI for speed but we must own the rigor. Pushing AI to be methodically rigorous by building from verified facts yielded better results, faster. I now look forward to the next complex investigation, hopefully a bit wiser than when I started this one.