Enhance your career, get Certified as a Data Streaming Engineer | Get Certified
How to centrally monitor Kafka clients via broker configuration
How to centrally monitor Kafka clients via broker configuration
Apache Kafka introduced KIP-714 in 3.7 release, which allows the Kafka broker to centrally track client metrics on behalf of applications. The broker can subsequently relay these metrics to a remote monitoring system, facilitating the effective monitoring of Kafka client health and the identification of any problems.
The broker requires a Metrics Reporter plugin which implements the ClientTelemetry interface to send client metrics to a remote monitoring system. This tutorial demonstrates how to use a plugin to monitor Kafka clients.
This tutorial adds ClientOtlpMetricsReporter that aggregates OpenTelemetry Protocol (OTLP) metrics received from the client, enhances them with additional client labels and forwards them via gRPC client to an external OTLP receiver. The plugin is implemented in Java and requires the JAR to be added to the Kafka broker libs.
The OTLP receiver for the tutorial is otel-collector, which is a part of the OpenTelemetry project. The otel-collector receives the metrics from the Kafka broker and forwards them to a Prometheus instance for visualization.
Prerequisites
- Java 17 or higher, e.g., follow the OpenJDK installation instructions here if you don't have Java.
- Docker running via Docker Desktop or Docker Engine
Setup and Cleanup
- Start OpenTelemetry Collector and Prometheus
- Build Client Telemetry Reporter Plugin jar
- Download and Setup Apache Kafka Broker
- Start Apache Kafka Client
- Cleanup
Start OpenTelemetry Collector and Prometheus
Clone the confluentinc/tutorials GitHub repository (if you haven't already), navigate to the tutorials directory, and start the OpenTelemetry collector and Prometheus:
git clone git@github.com:confluentinc/tutorials.git
cd tutorials
docker compose -f ./client-telemetry-reporter-plugin/kafka/docker-compose.yml up -d
In this example, we've configured the OTel collector (in client-telemetry-reporter-plugin/kafka/otel-collector-config.yaml) to receive OTLP metrics from the Kafka broker via gRPC on port 4317 and forwards them to Prometheus on port 8889. The configuration adds a namespace kip-714 to the metrics, which means that the metrics in Prometheus will all start with kip_714_, and can be used to identify the source of the metrics. The configuration also enables resource to telemetry conversion to add labels to the metrics.
Build the client-telemetry-reporter-plugin
Build the client-telemetry-reporter-plugin JAR.
./gradlew clean :client-telemetry-reporter-plugin:kafka:buildThe above command builds the client-telemetry-reporter-plugin JAR located at: client-telemetry-reporter-plugin/kafka/build/libs/client-telemetry-reporter-plugin.jar
Apache Kafka Broker
Download the Apache Kafka 3.8.0 or higher release from here. Any version of Kafka 3.7.0 or higher will work for client metrics but the plugin is written for Kafka 3.8.0 or higher.
wget https://downloads.apache.org/kafka/3.8.0/kafka_2.13-3.8.0.tgz
tar -xvf kafka_2.13-3.8.0.tgz
cd kafka_2.13-3.8.0
The pwd directory is referred to as <kafka_path> in the rest of the tutorial.
Add the client-telemetry-reporter-plugin to the Kafka Broker
Copy the client-telemetry-reporter-plugin.jar to the Kafka broker libs directory.
cp <tutorials_repo_path>/tutorials/client-telemetry-reporter-plugin/kafka/build/libs/client-telemetry-reporter-plugin.jar <kafka_path>/libs/Configure the Kafka Broker
Add the following configuration to the Kafka broker kraft properties file server.properties, located at <kafka_path>/kafka_2.13-3.8.0/config/kraft/server.properties.
# Add the client telemetry reporter plugin
metric.reporters=io.confluent.developer.ClientOtlpMetricsReporter
Start the Kafka Broker
KAFKA_CLUSTER_ID="$(bin/kafka-storage.sh random-uuid)"
./bin/kafka-storage.sh format -t $KAFKA_CLUSTER_ID -c config/kraft/server.properties
OTEL_EXPORTER_OTLP_ENDPOINT=127.0.0.1:4317 ./bin/kafka-server-start.sh config/kraft/server.properties
Create metrics subscription
Create a metrics subscription to receive client metrics from the Kafka broker.
./bin/kafka-client-metrics.sh --bootstrap-server localhost:9092 --alter --name <subscription_name> --metrics <metric_name_prefix> --interval <interval_ms>Examples:
The below command subscribes to all the metrics starting with (prefix match) org.apache.kafka.producer.record with an interval of 10 seconds.
./bin/kafka-client-metrics.sh --bootstrap-server localhost:9092 --alter --name producer-record-metrics --metrics "org.apache.kafka.producer.record" --interval 10000The below command subscribes to all the metrics with an interval of 10 seconds.
./bin/kafka-client-metrics.sh --bootstrap-server localhost:9092 --alter --name all-metrics --metrics "*" --interval 10000Create a Kafka Client
Create a Kafka client that sends metrics to the broker. The client should be using the Kafka client version 3.7.0 or higher.
Start console producer
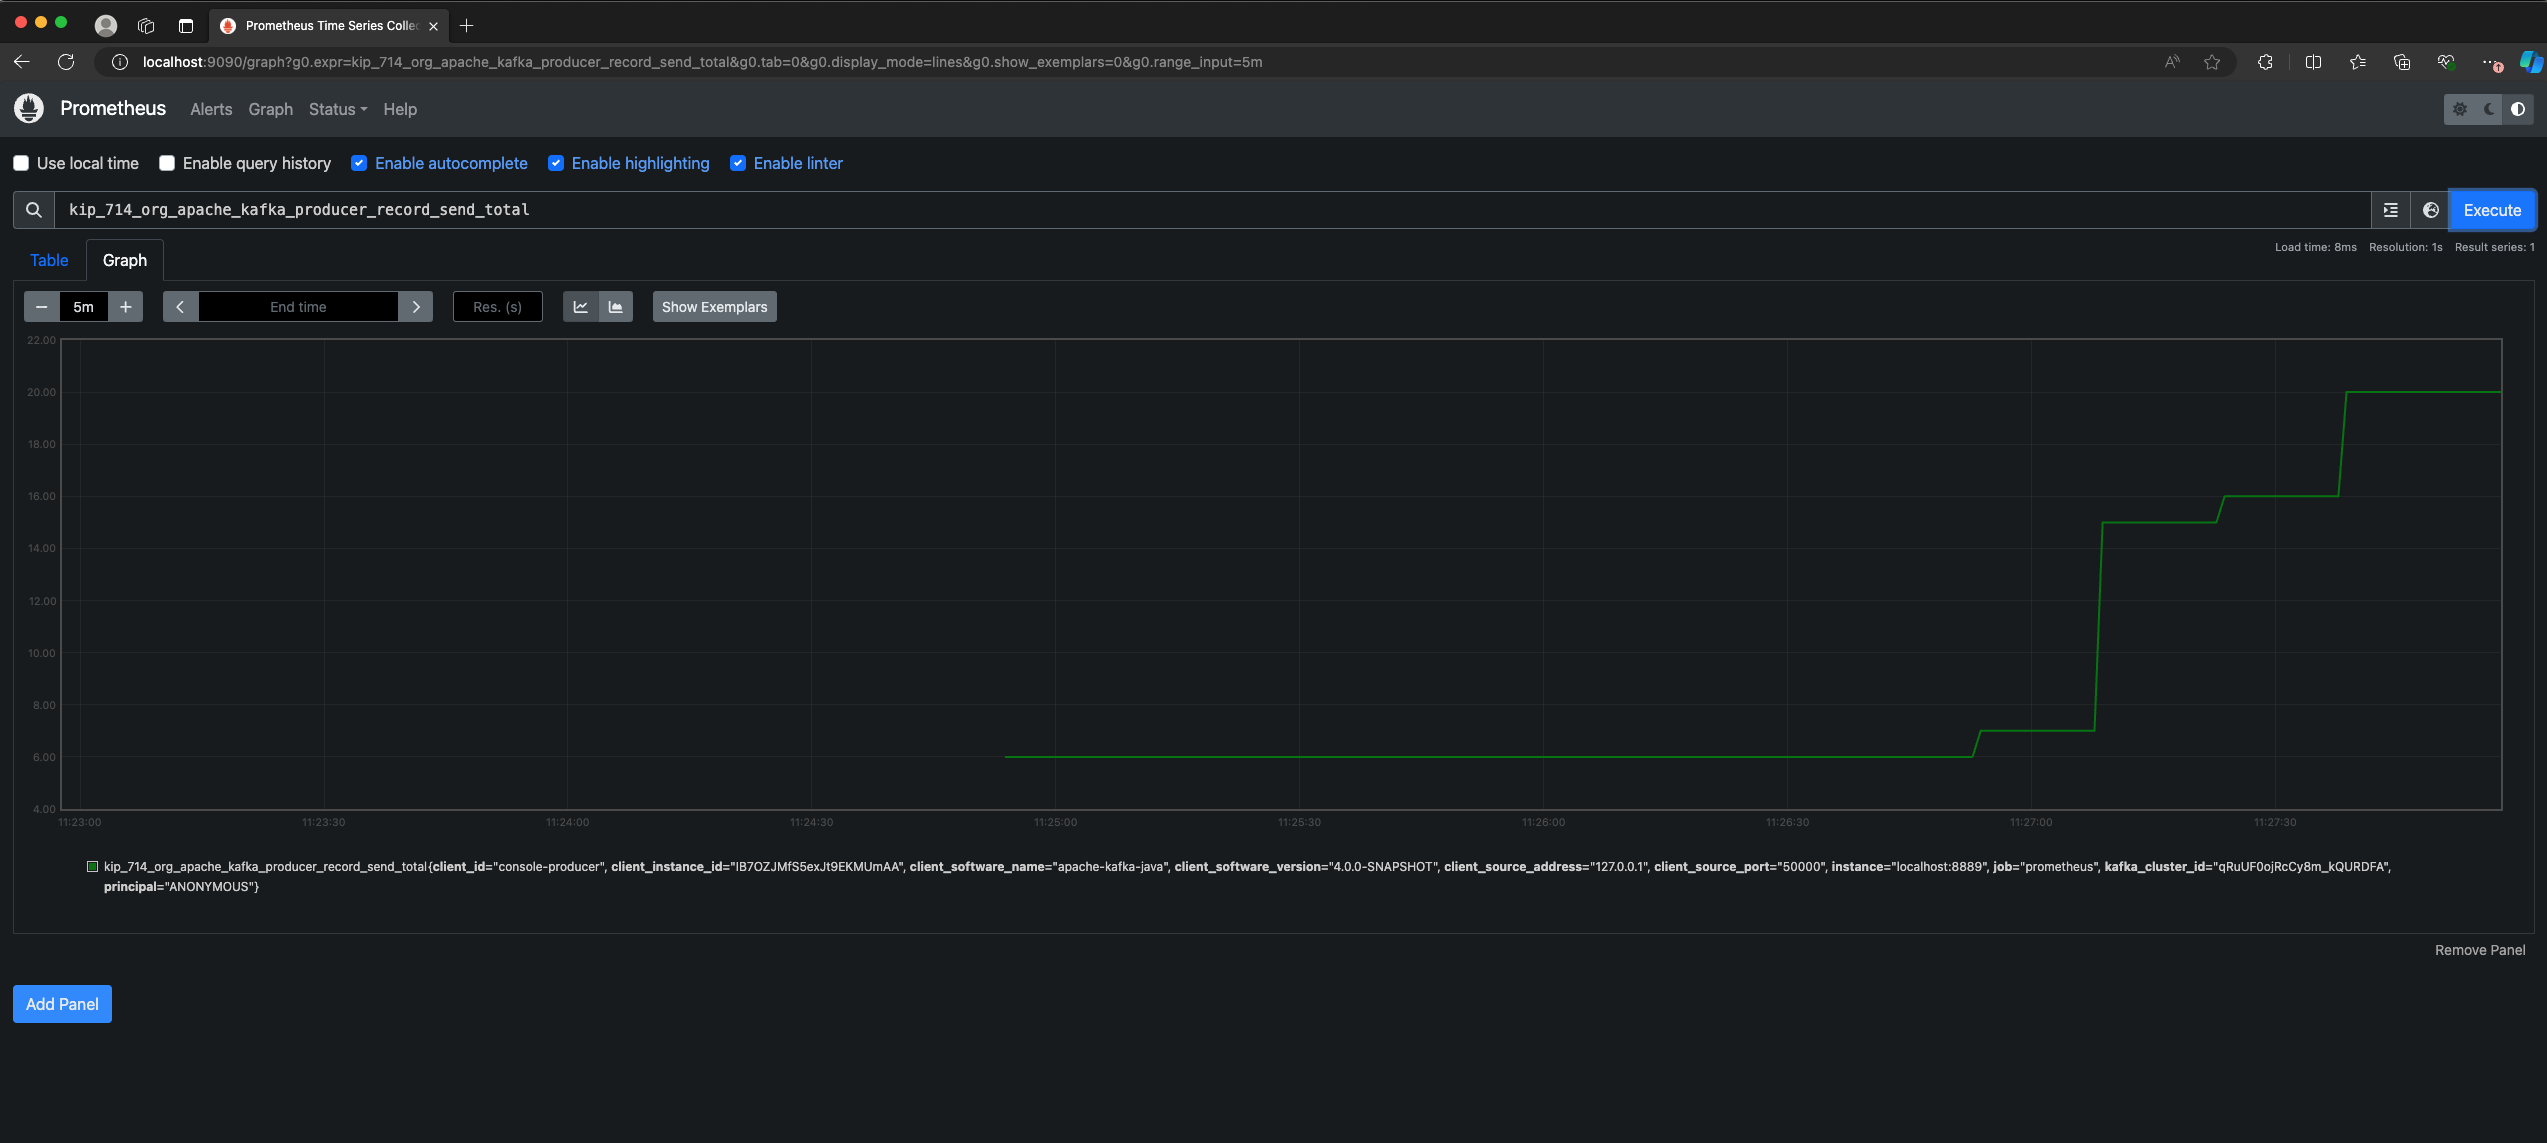
./bin/kafka-console-producer.sh --broker-list localhost:9092 --topic testAccess Client Metrics
Produce messages to the topic test and observe the metrics in the Prometheus instance. Prometheus can be accessed at http://localhost:9090. The metrics shall appear prefixed with kip_714 namespace.
The following log line indicates that the metrics are being sent by the plugin to the gRPC endpoint:
[grpc-default-executor-0] INFO io.confluent.developer.ClientOtlpMetricsReporter - Successfully exported metrics request to 127.0.0.1:4317Cleanup
Stop the Kafka broker, either by pressing Ctrl+C in the terminal where the broker is running or by running the following command from the Kafka directory:
./bin/kafka-server-stop.shStop the OpenTelemetry Collector and Prometheus containers by running the following command from the tutorials directory:
docker compose -f ./client-telemetry-reporter-plugin/kafka/docker-compose.yml down