Enhance your career, get your certificate as a Data Streaming Engineer | Get your Certificate
How to aggregate over cumulating windows with Flink SQL
How to aggregate over cumulating windows with Flink SQL
Suppose you have time series events in a Kafka topic and wish to simultaneously group them into fixed-size tumbling windows in addition to splitting each tumbling window into several windows having the same window start but having window ends that vary by a fixed step size. Flink SQL's cumulating windows do exactly that. For example, let's say you want to build an hourly revenue dashboard that also outputs revenue at the half hour mark so that you can simultaneously look at the hourly trend alongside any trends within the hour (e.g., does revenue peak earlier in the hour or later?). In this tutorial, we'll use Flink SQL cumulating windows to aggregate revenue from a table of orders and output total revenue for 10-minute widows in addition to revenue 5 minutes into the window.
Setup
Because windowed aggregations are calculated on a base table, let's assume the following DDL for our base orders table:
CREATE TABLE orders (
    order_id INT,
    item_id INT,
    quantity INT,
    unit_price DOUBLE,
    ts TIMESTAMP(3),
    -- declare ts as event time attribute and use strictly ascending timestamp watermark strategy
    WATERMARK FOR ts AS ts
)
The timestamp is an important attribute since we’ll be summing revenue over time. Also, because we are going to aggregate over time windows, we must define a watermark strategy. In this case, we use strictly ascending timestamps, i.e., any row with a timestamp that is less than or equal to the latest observed event timestamp is considered late and ignored.
Compute windowed aggregation
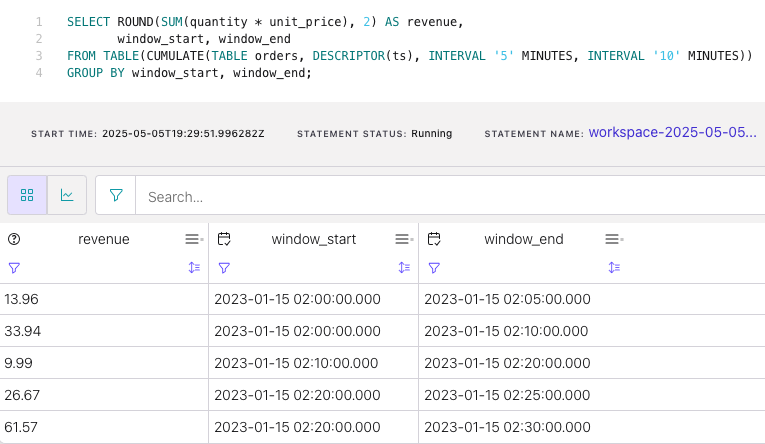
Given the orders table definition above, the following transient query sums revenue (quantity * unit_price) over cumulating windows. It uses a windowing table-valued function (TVF) to compute the revenue for 10-minute windows that also "fire early" every 5 minutes. It also captures the window start and end times.
SELECT ROUND(SUM(quantity * unit_price), 2) AS revenue,
    window_start,
    window_end
FROM TABLE(CUMULATE(TABLE orders, DESCRIPTOR(ts), INTERVAL '5' MINUTES, INTERVAL '10' MINUTES))
GROUP BY window_start, window_end;
Running the example
You can run the example backing this tutorial in one of three ways: a Flink Table API-based JUnit test, locally with the Flink SQL Client against Flink and Kafka running in Docker, or with Confluent Cloud.
Flink Table API-based test
Prerequisites
- Java 17, e.g., follow the OpenJDK installation instructions here if you don't have Java.
- Docker running via Docker Desktop or Docker Engine
Run the test
Clone the confluentinc/tutorials GitHub repository (if you haven't already) and navigate to the tutorials directory:
git clone git@github.com:confluentinc/tutorials.git
cd tutorials
Run the following command to execute FlinkSqlCumulatingWindowTest#testCumulatingWindows:
./gradlew clean :cunulating-windows:flinksql:testThe test starts Kafka and Schema Registry with Testcontainers, runs the Flink SQL commands above against a local Flink StreamExecutionEnvironment, and ensures that cumulating window query results are what we expect.
Flink SQL Client CLI
Prerequisites
- Docker running via Docker Desktop or Docker Engine
- Docker Compose. Ensure that the command docker compose version succeeds.
Run the commands
Clone the confluentinc/tutorials GitHub repository (if you haven't already) and navigate to the tutorials directory:
git clone git@github.com:confluentinc/tutorials.git
cd tutorials
Start Flink and Kafka:
docker compose -f ./docker/docker-compose-flinksql.yml up -dNext, open the Flink SQL Client CLI:
docker exec -it flink-sql-client sql-client.shFinally, run following SQL statements to create the orders table backed by Kafka running in Docker, populate it with test data, and run the cumulating windows query.
CREATE TABLE orders (
    order_id INT,
    item_id INT,
    quantity INT,
    unit_price DOUBLE,
    ts TIMESTAMP(3),
    -- declare ts as event time attribute and use strictly ascending timestamp watermark strategy
    WATERMARK FOR ts AS ts
) WITH (
    'connector' = 'kafka',
    'topic' = 'orders',
    'properties.bootstrap.servers' = 'broker:9092',
    'scan.startup.mode' = 'earliest-offset',
    'key.format' = 'raw',
    'key.fields' = 'order_id',
    'value.format' = 'avro-confluent',
    'value.avro-confluent.url' = 'http://schema-registry:8081',
    'value.fields-include' = 'ALL'
);
INSERT INTO orders VALUES
    (0, 100, 2, 6.98, TO_TIMESTAMP('2023-01-15 02:02:30')),
    (1, 102, 2, 9.99, TO_TIMESTAMP('2023-01-15 02:08:00')),
    (2, 102, 1, 9.99, TO_TIMESTAMP('2023-01-15 02:19:30')),
    (3, 203, 1, 8.10, TO_TIMESTAMP('2023-01-15 02:22:30')),
    (4, 192, 3, 6.19, TO_TIMESTAMP('2023-01-15 02:23:20')),
    (5, 100, 3, 6.98, TO_TIMESTAMP('2023-01-15 02:25:30')),
    (6, 100, 2, 6.98, TO_TIMESTAMP('2023-01-15 02:25:49')),
    (7, 632, 4, 8.00, TO_TIMESTAMP('2023-01-15 02:34:30'));
SELECT ROUND(SUM(quantity * unit_price), 2) AS revenue,
window_start,
window_end
FROM TABLE(CUMULATE(TABLE orders, DESCRIPTOR(ts), INTERVAL '5' MINUTES, INTERVAL '10' MINUTES))
GROUP BY window_start, window_end;The query output should look like this:
                      revenue            window_start              window_end
                        13.96 2023-01-15 02:00:00.000 2023-01-15 02:05:00.000
                        33.94 2023-01-15 02:00:00.000 2023-01-15 02:10:00.000
                         9.99 2023-01-15 02:10:00.000 2023-01-15 02:20:00.000
                        26.67 2023-01-15 02:20:00.000 2023-01-15 02:25:00.000
                        61.57 2023-01-15 02:20:00.000 2023-01-15 02:30:00.000
When you are finished, clean up the containers used for this tutorial by running:
docker compose -f ./docker/docker-compose-flinksql.yml downConfluent Cloud
Prerequisites
- A Confluent Cloud account
- A Flink compute pool created in Confluent Cloud. Follow this quick start to create one.
Run the commands
In the Confluent Cloud Console, navigate to your environment and then click the Open SQL Workspace button for the compute pool that you have created.
Select the default catalog (Confluent Cloud environment) and database (Kafka cluster) to use with the dropdowns at the top right.
Finally, run following SQL statements to create the orders table, populate it with test data, and run the cumulating windows query.
CREATE TABLE orders (
    order_id INT,
    item_id INT,
    quantity INT,
    unit_price DOUBLE,
    ts TIMESTAMP(3),
    -- declare ts as event time attribute and use strictly ascending timestamp watermark strategy
    WATERMARK FOR ts AS ts
);
INSERT INTO orders VALUES
(0, 100, 2, 6.98, TO_TIMESTAMP('2023-01-15 02:02:30')),
(1, 102, 2, 9.99, TO_TIMESTAMP('2023-01-15 02:08:00')),
(2, 102, 1, 9.99, TO_TIMESTAMP('2023-01-15 02:19:30')),
(3, 203, 1, 8.10, TO_TIMESTAMP('2023-01-15 02:22:30')),
(4, 192, 3, 6.19, TO_TIMESTAMP('2023-01-15 02:23:20')),
(5, 100, 3, 6.98, TO_TIMESTAMP('2023-01-15 02:25:30')),
(6, 100, 2, 6.98, TO_TIMESTAMP('2023-01-15 02:25:49')),
(7, 632, 4, 8.00, TO_TIMESTAMP('2023-01-15 02:34:30'));SELECT ROUND(SUM(quantity * unit_price), 2) AS revenue,
window_start, window_end
FROM TABLE(CUMULATE(TABLE orders, DESCRIPTOR(ts), INTERVAL '5' MINUTES, INTERVAL '10' MINUTES))
GROUP BY window_start, window_end;The query output should look like this: