Absolutely Everything You Always Wanted to Know About Watermarks in Apache Flink - Part 2: Confluent Cloud for Apache Flink
This is the second part of a 2-part deep-dive post dedicated to explaining Watermarks in Apache Flink®. In Part 1 we covered in great depth watermarks in Apache Flink. In this Part 2, we'll look at how watermarks behave in Confluent Cloud for Apache Flink (for brevity, CCAF in the rest of this post).
One of the most significant differences in how watermarks behave on Confluent Cloud is the default Watermark Generation. The default behavior is good for most use cases, and lowers the barrier for new users. However, if you are familiar with time-semantics and you start tuning, the default can turn into a footgun if you do not understand it correctly (this is the story of all frameworks).
For example, imagine you are happy with the default Kafka record timestamp as time attribute. But you decide to set it explicitly, to some business event-time, instead of letting Kafka or the producer set it to the current system time. In this scenario you should also define your custom Watermark delay, because the default 180 ms will probably cause many Late Events. See implications of default watermarks.
Contents
- Event-time Only, or So It Seems
- Default Watermark Generation
- Default Idle Partition Detection - Progressive Idle Partition Timeout
- Default Watermark Alignment
- Default Watermarks Under the Hood
- Handling Late Events
- Confluent Cloud for Apache Flink Watermarks vs Apache Flink Watermarks - Recap
- Observing Watermarks in Confluent Cloud for Apache Flink
- Confluent Cloud for Apache Flink Documentation References
- Conclusion
Event-time Only, or So It Seems
First and foremost, by design CCAF supports event-time semantics only. Among other reasons, this is to provide nearly identical semantics when running the query multiple times on the same dataset, and when running the query in batch mode (Snapshot queries in Confluent Cloud).
However, CCAF also provides a Default Watermark behavior which makes it almost behave like processing time, at least when you are processing data in real-time, with a negligible lag.
But let's go in order and approach the subject in a more structured way, as we did in Part 1.
Note: Every discussion in this article refers to Kafka Sources. This is because CCAF only reads from Kafka topics, not other sources. If you want to get data in and out of other systems (such as databases, etc) with Confluent Cloud you should use the many connectors available.
Default Watermark Generation
Unlike Apache Flink, if you use CCAF you'll find that it defines a default Watermark strategy (which you can override), and a metadata field.
$rowtime Metadata Field
Every Flink table in Confluent Cloud has a metadata field $rowtime (type: TIMESTAMP_LTZ(3)) which contains the Kafka record timestamp.
Default Watermark Strategy
Every table has a default WATERMARK, unless you override it. The Default Watermark is based on:
- Event-time (time attribute): $rowtime, Apache Kafka® record timestamp
- Watermark Delay Interval: 180 ms
This is similar to defining a Watermark as WATERMARK FOR $rowtime AS $rowtime - INTERVAL '0.180' SECOND.
More precisely, the default Watermark is equivalent to WATERMARK FOR $rowtime AS SOURCE_WATERMARK(), as we will see later.
(Default) Watermark Emission
Confluent Cloud uses the same default Watermark Emission Interval as Apache Flink, 200 ms. Differently from Apache Flink, this cannot be customized by changing pipeline.auto-watermark-interval.
Also differently from Apache Flink, in the first 200 ms (in wall-clock domain), it emits a Watermark on every single message.
The rationale is to improve the developer experience.
- During development, a topic may contain very few records, and Flink may read them entirely in less than 200 ms. Without per-message Watermarks in this early phase, no Watermark would be emitted at all, making troubleshooting harder.
- Conversely, during normal processing, emitting one Watermark per record would be an overhead. One every 200 ms is sufficient even for sub-second latency use cases.
Implications of Default Watermarks
As we have seen, the default Watermarks are based on the Kafka record timestamp.
Kafka Record Timestamp Generation
To understand the implications of default Watermarks, we must first look at how the Kafka record timestamp is generated.
How the record timestamp is populated depends on the producer's behavior and on a couple of configuration parameters: message.timestamp.type, at topic-level, and log.message.timestamp.type, at cluster-level.
- If message.timestamp.type or log.message.timestamp.type = CreateTime (default), the timestamp is delegated to the producer. The producer can either set the timestamp explicitly (for example, by setting ProducerRecord.timestamp in the Java client) or use the default, which is the producer's system clock at the moment the ProducerRecord was instantiated.
- If message.timestamp.type or log.message.timestamp.type = LogAppendTime, the timestamp is set by the broker when the record is appended to the log. Any timestamp set by the producer is ignored.
When the timestamp is set by the producer, is it validated by the broker?
The answer is "yes". The validation depends on a couple of other configuration parameters, at topic-level or cluster-level:
- message.timestamp.before.max.ms or log.message.timestamp.before.max.ms: rejects any past timestamp older than this interval, compared to the broker's system clock.
- message.timestamp.after.max.ms or log.message.timestamp.after.max.ms: rejects any timestamp further in the future than this interval, compared to the broker's system clock.
Note: there is also the legacy parameter message.timestamp.difference.max.ms which defines a symmetric interval. The .before. and .after. new parameters take precedence over the legacy one.
Topic-level configurations always take precedence over cluster-level configuration.
Important: In Confluent Cloud, the user can set these parameters at topic-level, but the cluster-level parameters (log...) cannot be modified.
The default values for these parameters have consequences: log.message.timestamp.type = CreateTime allows the producer to override the timestamp, and the default limits practically allow -∞ to +∞. We will get to these consequences in a minute.
Kafka Record Timestamp ~ Kafka Ingestion Time - Out-of-orderness
If the producer does not set the record timestamp (or if the timestamp set by the producer is ignored, because message.timestamp.type = LogAppendTime), the Kafka record timestamp is Kafka Ingestion Time.
This has an important implication: (practically) no out-of-orderness, per partition. It means, in each Kafka partition, events are in order by Kafka record timestamp.
Note: the "practically" no out-of-orderness, above, conveys an important caveat. Unless the timestamp is decided by the broker (when message.timestamp.type = LogAppendTime, which is not the default) some out-of-orderness may still happen. Multiple producers can have system clocks slightly out of sync. Producers' retries may cause events to be ingested out of order across multiple producers.
Implications of Default Watermarks for Flink Statements
Bringing everything together:
- Default Watermarks in Confluent Cloud...
- are based on Kafka record timestamp ($rowtime)
- have a minimal Watermark delay of 180 milliseconds
- If the record timestamp is set by the broker (message.timestamp.type = LogAppendTime)
- Record timestamp == Kafka ingestion time
- Records are strictly in order, per partition
- If message.timestamp.type = CreateTime (default), but the producer does not set the timestamp explicitly
- Record timestamp ~= Kafka ingestion time
- Records are almost in-order in the partition
Implication #1
When a statement is consuming data in real-time (with minimal lag) and continuously (no long, completely idle periods), the Watermark time is very close to the current system time (processing-time).
The small lag from the system time is due to:
- Kafka write-to-read latency, usually < 100 ms
- 180 ms Watermark Delay, which practically may be up to 200 ms because Watermarks are not emitted on every record, but every 200 ms.
In practice, the lag between the default Watermark time and current system time is < 300 ms, assuming the Flink statement is consuming from the Kafka topic with a negligible offset lag.
The very short Default Watermark Delay is designed to minimize end-to-end latency, while still minimizing or eliminating the risk of Late Events, as the next implication explains.
Don't let this confuse you: This doesn't mean default Watermarks in Confluent Cloud implement processing-time. It means the difference between processing-time and event-time is small, under the very specific conditions mentioned.
Implication #2
Unless the producer sets an arbitrary record timestamp, you should not observe Late Events.
If message.timestamp.type = LogAppendTime, this is guaranteed.
If message.timestamp.type = CreateTime (default), Late Events are very rare, but their absence is not guaranteed, due to retries and producers' system clock skews.
Implication #3
If message.timestamp.type = CreateTime (again, the default) and the producer sets an arbitrary record timestamp, default Watermarks may cause many Late Events, which are dropped by default.
In this case, you should always define Custom Watermarks by setting a Watermark Delay which takes into account the actual out-of-orderness.
Corollary
Setting message.timestamp.type = LogAppendTime at topic-level is the safest option, unless you are already planning to define a Custom Watermark, probably to use an event-time attribute different than $rowtime. This protects you from producers overriding the record timestamp with some "crazy" timestamp, and also protects you from accidental out-of-orderness caused by producers' retries.
Overriding Default Watermarks - Custom Watermark Definition
In Confluent Cloud you can override the Default Watermarks by simply defining your own Watermarks in the table definition. The syntax is identical to Apache Flink:
CREATE TABLE orders
    ...
    WATERMARK FOR order_time AS order_time - INTERVAL '30' SECOND
The $rowtime metadata field is still visible, but not used as event-time attribute.
You can also define a Watermark using the Kafka record timestamp as time attribute, but with a custom Watermark Delay:
CREATE TABLE my_table
    ...
    WATERMARK FOR $rowtime AS $rowtime - INTERVAL '30' SECOND
Similarly, you can change the Watermark definition of an existing table:
ALTER TABLE orders
MODIFY WATERMARK FOR order_time AS order_time - INTERVAL '30' SECOND
If you use an event-time attribute which is different from Kafka record timestamp ($rowtime), the implications we mentioned are no longer true.
Watermark time can get far behind the current system-time, and their difference may vary over time, even when you are processing data in real-time.
The volume of Late Events depends on the actual out-of-orderness compared to the Watermark Delay, and it may also vary over time.
You can always drop a custom Watermark definition, and return to the default:
ALTER TABLE orders DROP WATERMARKDefault Idle Partition Detection - Progressive Idle Partition Timeout
Differently from Apache Flink, in Confluent Cloud Idle Partition Detection is enabled by default.
Also, the default Idle Partition Timeout is not fixed, but uses a progressive (in the sense it gradually increases) algorithm:
- The timeout starts at 10 seconds when the statement starts
- The timeout progressively increases to 5 minutes
Additionally, as soon as an input Kafka partition is marked Idle, a Watermark with the latest observed record timestamp is emitted (Watermark "flushing").
The timeout is reset to 10 seconds every time the statement restarts, including when the statement is automatically restarted after a crash or for a scaling event, which is otherwise transparent to the user in Confluent Cloud.
Rationale
When a statement starts, we do not want to wait too long to see Watermarks progressing, even when a single source Kafka partition contains no data, but others do contain data.
Conversely, when the statement has been running for a while (in production, for example) we do not want an input partition to be considered idle too early, possibly for a temporary pause of the processing.
Customizing or Disabling Idle Partition Detection
You can customize Idle Partition Timeout by setting the sql.tables.scan.idle-timeout property to a specific interval:
SET 'sql.tables.scan.idle-timeout' = '30s';This also disables the progressive timeout behavior.
IMPORTANT: Idle Partition Timeout must always be less than or equal to Max Allowed Drift used for Watermark Alignment, or they may cause issues.
Setting Idle Timeout to '0' completely disables Idle Partition Detection.
SET 'sql.tables.scan.idle-timeout' = '0';When Idle Partition Detection is disabled, any Kafka input partition temporarily not receiving records blocks the progress of the Watermark.
Disabling Idle Partition Detection also means that Source Subtasks never emit any Idle Watermark Status signal, and downstream Subtasks also never mark any input Channel as Idle. Any single Kafka partition receiving no record causes Watermarks to get "stuck" across the entire dataflow.
When a statement reads from multiple tables/topics, you can selectively set different custom Idle Timeout or selectively disable Idle Detection, on a per-table/topic basis. This can be achieved using SQL hints:
SELECT *
FROM
  orders /*+ OPTIONS('sql.tables.scan.idle-timeout'='15s') */ AS o
JOIN
  customers /*+ OPTIONS('sql.tables.scan.idle-timeout'='2m') */ AS c
ON o.customer_id = c.customer_id;
Default Watermark Alignment
Differently from Apache Flink, in Confluent Cloud Watermark Alignment is also enabled by default, with a Max Allowed Drift of 5 minutes.
Watermark Drift is also calculated across all sources. This is equivalent to specifying the same scan.watermark.alignment.group for all source tables in OSS Flink. At the time of writing, the alignment group cannot be modified.
In Part 1, we mentioned how Watermark Alignment may interact with Idle Partition Detection and how Max Allowed Drift >= Idle Partition Timeout must always be true.
In fact, the default 5 minutes Max Allowed Drift is equal to the maximum Idle Timeout the default progressive algorithm can get to (starts at 10 sec, increases to 5 min).
Customizing Watermark Alignment
Max Allowed Drift can be customized by modifying the sql.tables.scan.watermark-alignment.max-allowed-drift property.
SET 'sql.tables.scan.watermark-alignment.max-allowed-drift' = '10m';DO NOT FORGET: if you decrease max-allowed-drift, also decrease Idle Partition Timeout to be Max Allowed Drift >= Idle Partition Timeout. See Interaction between Watermark Alignment and Idle Partition Detection in Part 1.
Disabling Watermark Alignment
Watermark Alignment can be completely disabled by setting Max Allowed Drift to '0'.
SET 'sql.tables.scan.watermark-alignment.max-allowed-drift' = '0';This may be useful if your statement does not use any time-based operation, so it does not rely on Watermarks at all.
In these cases, Watermark Alignment may actually slow down the overall processing, in particular when processing big backlogs from very unevenly populated partitions.
Reasons to Override the Default Watermark Alignment
- Reasons to increase Max Allowed Drift: if you increase Idle Partition Timeout you must also increase Max Allowed Drift, to be equal or greater.
- Reasons to decrease Max Allowed Drift: if you have very high throughput and very short time-window operations (shorter than Max Allowed Drift), Watermark Alignment may cause more data to be buffered. In these cases you may want to reduce it, to match the window size.
- Reasons to disable Watermark Alignment: if your statement has no time-based logic. Watermark drift would not cause any additional buffering, and Watermark Alignment may potentially slow down reading when processing big backlogs of messages.
Default Watermarks Under the Hood
CCAF uses the proprietary confluent Source Connector which supports Watermark Generation. Practically, every table has a Watermark definition equivalent to WATERMARK FOR $rowtime AS SOURCE_WATERMARK(), unless overridden.
Handling Late Events
In Apache Flink SQL, Late Events, defined as events with event_time ≤ last_emitted_watermark_time, are dropped by many time-based operators.
Confluent Cloud provides an extension to handle late-arriving data.
This feature is optional and disabled by default. To enable it, set the option 'late-handling.mode' = 'filter' on the source table.
- If late-handling.mode is not specified, or if it is set to the default pass-through, Late Events are processed by the statement and potentially dropped by time-based Operators, similarly to Apache Flink.
- If late-handling.mode is set to filter, Late Events are identified by the Source Operator and routed to a special system table, called <table_name>$late, instead of being processed by the statement. You can query this table or create a statement to process Late Events in some special way.
Don't let this confuse you: When late-handling.mode is set to filter, Late Events are routed to the system table regardless of whether your statement contains time-based operators or not.
Confluent Cloud for Apache Flink Watermarks vs Apache Flink Watermarks - Recap
Let's recap differences and similarities between CCAF and Apache Flink, in terms of Watermarks.
Same as Apache Flink
- The mechanism for generating, emitting, and propagating Watermarks, based on records read from the Kafka partitions, is identical to Apache Flink.
- The mechanism for detecting Idle Kafka partitions is the same.
- The mechanism for aligning Watermarks across Kafka partitions is the same.
- Time-based operators use Watermarks as in Apache Flink; similarly, some operators block or propagate Watermarks in special ways.
Different from Apache Flink
- Default Watermarks are based on Kafka record timestamp, with a minimal Delay (180 ms). Can be customized by defining a different event-time attribute and/or a different Delay.
- The $rowtime metadata field is automatically added to every table and contains the Kafka record timestamp.
- Watermark Emission Interval is the same as Apache Flink default (200 ms), but Watermarks are emitted on every single message in the first 200 milliseconds. Cannot be overridden (setting pipeline.auto-watermark-interval is not supported).
- No support for Processing-time semantics. We have seen how the Default Watermarks are close to system-time, when processing in real-time and under some conditions.
- Idle Partition Detection is enabled by default. Idle Partition Timeout increases progressively over time. Can be customized or disabled.
- Watermark Alignment is enabled by default with a Max Allowed Drift of 5 min. Can be customized or disabled.
- Late Events (Late-Arriving Data) can be sent to a system table, instead of being silently dropped.
Observing Watermarks in Confluent Cloud for Apache Flink
You can observe Watermarks in the Confluent Cloud UI and in particular the Query Profiler. This is handy for troubleshooting.
You can also use the exposed metrics, for long-term monitoring.
UI and Query Profiler
As of August 2026, the Confluent Cloud UI, and Query Profiler in particular, show Watermark delay, Late event counts (Late-arriving data), and information about partition idleness and alignment.
Here, Watermark "delay" is defined as difference between the Watermark and the current time. If the difference is negligible (less than 60 seconds), the UI shows "Up to date". Otherwise it shows the delay in minutes/hours/days, or an absolute date if the delay is extremely long.
Don't let this confuse you. The "Watermark delay" shown by Query Profiler is not the Watermark Delay defining the maximum out-of-orderness. It's the "delay" from real-time (now).
- Input Watermark delay at Statement level is defined as now - MIN (oldest) Watermark across all Subtasks of all Sources.
- Output Watermark delay at Statement level is calculated across all Sinks.
- Watermark delay at Task level is defined as now - MIN (oldest) Watermark across all Subtasks of this Task.
UI Walkthrough
Let's have a quick walkthrough of the UI, looking for information related to Watermarks. Note that this is as of August 2026. Confluent Cloud UI is in constant evolution and this will likely change in the future.
From the Compute Pool page, you can access the general Statement status by clicking on the Statement Name. In the screenshots, we see a temporal join with two source tables and one sink table.
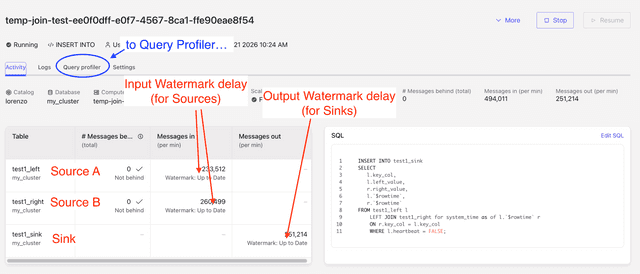
You can see:
- Input Watermark delay for all Sources
- Output Watermark delay for all Sinks
To drill down in more details you can access the Query Profiler.
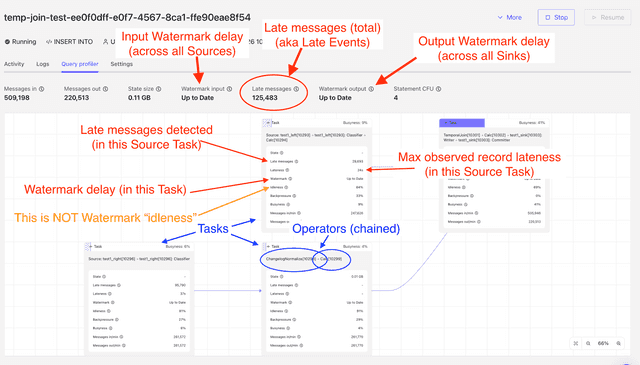
This view shows a lot of information about Watermarks.
At Statement level:
- Input Watermark delay, across all Sources
- Output Watermark delay, across all Sinks
- Total Late Events (Late messages) identified at the Source Operator.
Don't let this confuse you: the Late Event count does not mean these events were dropped. This metric counts the number of events identified by the Source as "late" (event_time ≤ last_emitted_watermark_time). These events are dropped only if your statement has time-based Operators and if you haven't enabled Late-data Handling. Also, the metric counts these events since the last Job restart, which may happen during normal operations, for example due to an autoscaling event. Consider this counter as an indicator that your Watermark settings may not be good, and you may have to increase the Watermark Delay interval.
At Task level:
- Watermark delay, across all Subtasks; as Output Watermark delay, with the exception of Tasks containing Sinks, where it shows the Input Watermark delay (there is no Output Watermark).
- Late Events (Late messages) at this Task
This view also shows the dataflow of the running statement. Each box is a Task, which can be a single Operator or, more frequently, a Chain of multiple Operators. If you are familiar with Apache Flink UI, this view is similar.
Don't let this confuse you: the "Idleness" shown in this view refers to the idleness of the Task which is not processing records because it receives no input, as opposed to the "busyness". This is NOT Watermark idleness.
Clicking on the Task "box", a pane opens with details about this Task.
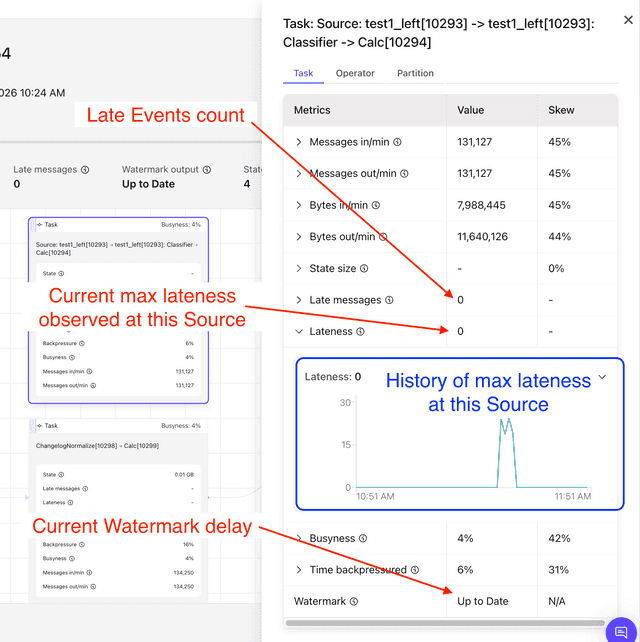
From the perspective of Watermark, this is a zoom-in, showing the same information we can see in the general view, for this Task. For Source Tasks, it also shows the count of recent Late messages (Late events), the maximum Lateness observed across received records in the last minute. You can also visualize the history of Late messages and Lateness, up to 7 days.
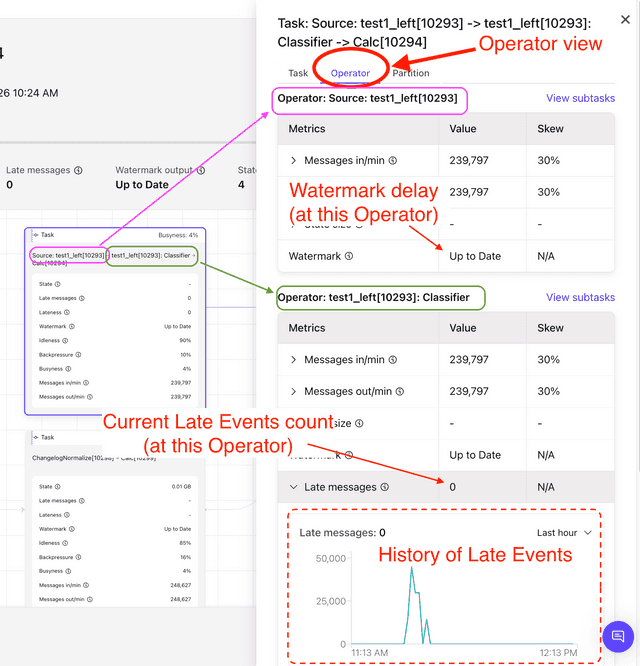
The Operator tab gives a break-down view of the Operators, chained together in the Task.
The Partition tab gives us very useful information at the level of the single Kafka partitions read by a Source. This view shows no information if the Task does not contain a Source Operator.
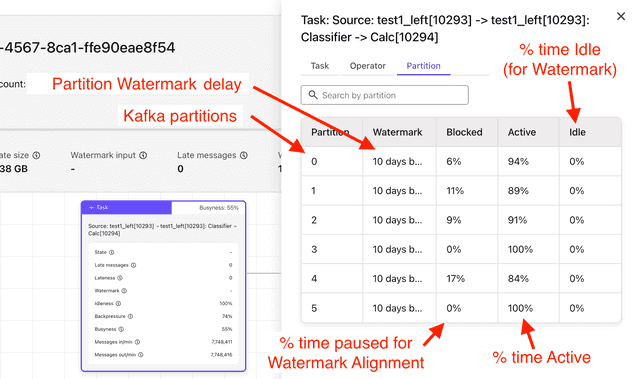
For each Kafka partition:
- Watermark delay
- % of time consuming from the partition has been Paused ("blocked") due to Watermark Alignment
- % of time the partition has been Active, from Watermark generation point of view (i.e. the partition was considered for Watermarks)
- % of time the partition has been Idle, from Watermark generation point of view (the partition was ignored for Watermark)
Don't let this confuse you: Note that, in this page "Idle" means "Idle from the perspective of Watermarks"
Metrics
CCAF exposes several metrics related to Watermarks.
The metrics exposed are continuously expanded. Here is a non-exhaustive list, with some comments. Refer to the Metrics reference for the full, up-to-date list of metrics.
- io.confluent.flink/current_input_watermark_milliseconds and current_output_watermark_milliseconds (Gauge metrics): Input and output Watermark timestamp, at Statement level, for a single Source or Sink table
- io.confluent.flink/num_late_records_in (Counter): Total count of Late Events observed in a single Source table of a Statement
- io.confluent.flink/max_input_lateness_milliseconds (Gauge): Max observed lateness, in milliseconds, across all records received in the last minute by a Statement.
Lateness is defined as the difference between the Watermark time and the record time
Similar metrics are also exposed at Operator level and Partition level (called Split). You can recognize them by the path io.confluent.flink/operator/... and io.confluent.flink/split/... respectively. At Partition level, the milliseconds-per-second the partition was Active, Idle, or "Blocked" (paused for Watermark Alignment) are also exposed.
Don't let this confuse you: the term Split is the generalized term in Apache Flink for an input "partition" read by a Source Operator. For Kafka, "Splits" are the "Kafka partitions".
Confluent Cloud for Apache Flink Documentation References
Most relevant public documentation references, as of August 2026:
- Time and Watermarks in Confluent Cloud for Apache Flink
- $rowtime
- WATERMARK clause
- SOURCE_WATERMARK()
- Late data handling
- Use the Flink SQL Query Profiler in Confluent Cloud for Apache Flink
Conclusion
In Part 1 of this two-part blog post, we had a deep-dive into Watermarks functionalities of Apache Flink. These subjects also apply to Confluent Cloud.
In this second part, we have covered the different defaults and extensions to Watermark functionalities introduced by Confluent Cloud for Apache Flink.
In particular, the Default Watermark Generation, based on Kafka record timestamp. This default has important implications.
Idle Partition Detection and Watermark Alignment are also enabled by default in Confluent Cloud.
These defaults can be overridden, defining your own Watermarks, with the same syntax used in Apache Flink.
Finally, we have seen a quick walkthrough of tools and metrics made available to monitor and troubleshoot Watermarks in your Flink SQL statements in Confluent Cloud.