Using the Flink Web UI (Exercise)

David Anderson
Software Practice Lead
Using the Flink Web UI (Exercise)
In this hands-on exercise you'll learn how to use Flink's Web UI to inspect and understand what's happening inside of Flink while it executes different SQL queries.
Begin by using what you learned in the previous exercise to start an unbounded streaming query, such as this one:
select count(*) from pageviews;Using your web browser, visit http://localhost:8081, which will bring up the Flink Web UI. Please explore it to your heart's content, but be sure to click on the collect job in the Running Job List.
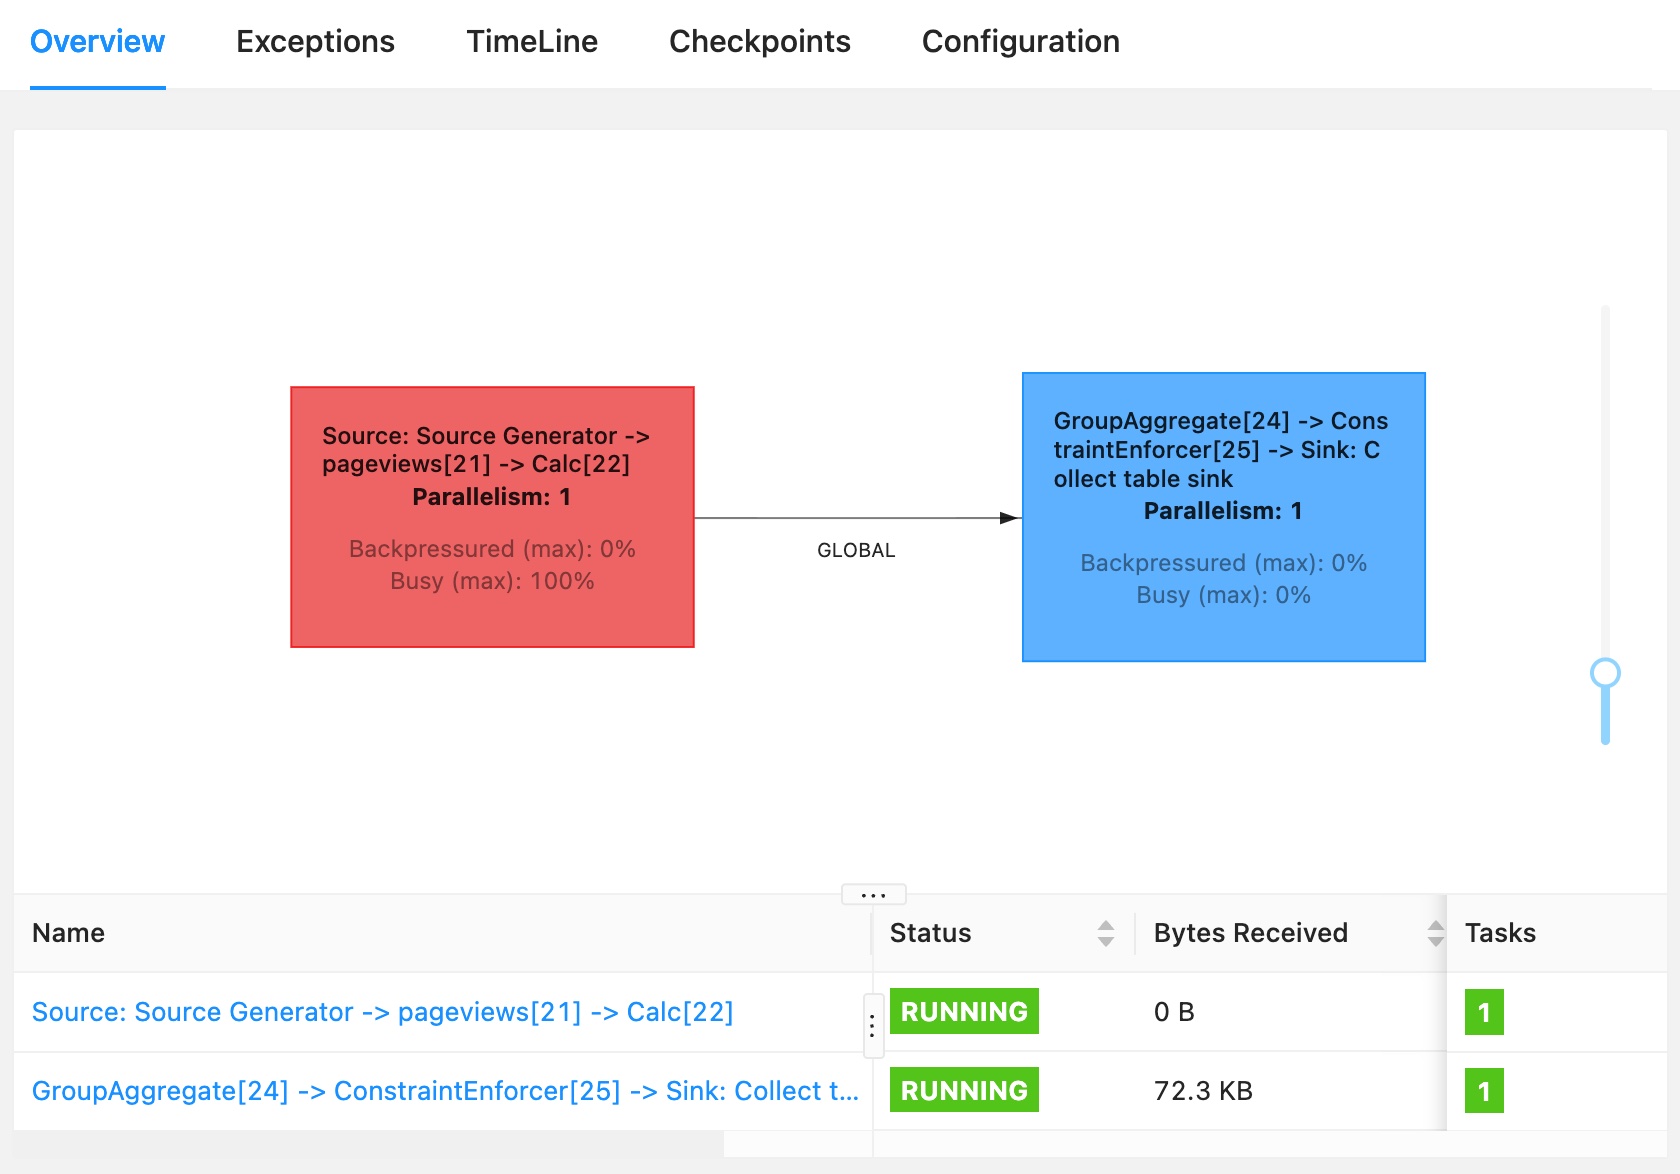
What you are seeing now is a periodically updating view of the Flink job created to run your query. In the heart of the screen you should see the job graph for this job looking something like this:

In the table below the job graph you can see some metrics about the behavior of this job, and the two stages of its pipeline. These nodes in the job graph are the two tasks that make up this job. Each task consists of one or more operators connected by forwarding connections, and each task runs as a single thread.
At any moment, a Flink task is in one of three states: idle, busy, or backpressured. (Backpressured means that the task is unable to send output downstream because the downstream task is busy.) In this case the source task at the left is shown in red because it is busy 100% of the time. The reason for this has to do with how flink-faker is implemented. In general, tasks that are always busy are a concern, but here's it okay.
You can click on either of the rows in the table, or either of the two colored boxes in the job graph, to drill into and inspect each task in the job graph.
If you now stop the query (in the SQL Client), you'll see that this job is canceled. You can click on Overview in the sidebar of the Web UI to return to the top-level view that shows both running and completed jobs.
If you return now to the SQL Client, and use EXPLAIN select count(*) from pageviews, you'll see output that contains the execution plan for this query:
Flink SQL> EXPLAIN select count(*) from pageviews;

...

== Optimized Execution Plan ==
GroupAggregate(select=[COUNT(*) AS EXPR$0])
+- Exchange(distribution=[single])
   +- Calc(select=[0 AS $f0])
      +- TableSourceScan(table=[[default_catalog, default_database, pageviews]], fields=[url, user_id, browser, ts])

...
This may appear a bit overwhelming, but this directly relates to what you saw in the job graph -- the Exchange in the query plan is separating the two tasks in the job graph, one of which is getting the input from the source and selecting the appropriate fields (all of them, in this case, since we did select *), and the other task is computing the grouped aggregation.
In later exercises we'll return to the Web UI to examine checkpoints and watermarks.
Resources
Community
Do you have questions or comments? Join us in the #confluent-developer community Slack channel to engage in discussions with the creators of this content.
Use the promo codes FLINK101 & CONFLUENTDEV1 to get $25 of free Confluent Cloud usage and skip credit card entry.
Be the first to get updates and new content
We will only share developer content and updates, including notifications when new content is added. We will never send you sales emails. 🙂 By subscribing, you understand we will process your personal information in accordance with our Privacy Statement.
