Enhance your career, get your certificate as a Data Streaming Engineer | Get your Certificate
Hands On: Streaming Data from Kafka to Elasticsearch with Kafka Connect


Tim Berglund
VP Developer Relations
Hands On: Streaming Data from Kafka to Elasticsearch with Kafka Connect
This exercise is the culmination of a pipeline project that takes streams of ratings events, filters them, and enriches them with information about the customer using data streamed from a database.

For the final step, we will stream the enriched data out to Elasticsearch from where it can be built into a dashboard. You need to have an Elasticsearch instance created as described in the first exercise, and it must be accessible from the internet.
-
In Confluent Cloud, click on the Connectors link, click Add connector, and search for the "Elasticsearch Service Sink" connector.

Click on the tile to create the sink connector.
-
Configure the connector as follows. You can leave blank any options that are not specified below.
Which topics do you want to get data from?
topics
ratings-enriched
Input messages
Input message format
AVRO
Kafka Cluster credentials
Kafka API Key
Use the same API details as you created for the Datagen connector previously. You can create a new API key if necessary, but API key numbers are limited so for the purposes of this exercise only it’s best to re-use if you can.
Kafka API Secret
How should we connect to your Elasticsearch Service?
Connection URI
These values will depend on where your Elasticsearch instance is and how you have configured it. Elasticsearch needs to be open to inbound connections from the internet.
Connection username
Connection password
Data Conversion
Type name
_doc
Key ignore
true
Schema ignore
true
Connection Details
Batch size
5 (this is a setting only suitable for this exercise; in practice you would leave it as the default or set it much higher for performance reasons).
Number of tasks for this connector
Tasks
1
Click Next to test the connection and validate the configuration.
-
On the next screen, the JSON configuration should be similar to that shown below. If it is not, return to the previous screen to amend it as needed.
{
  "name": "ElasticsearchSinkConnector_0",
  "config": {
    "topics": "ratings-enriched",
    "input.data.format": "AVRO",
    "connector.class": "ElasticsearchSink",
    "name": "ElasticsearchSinkConnector_0",
    "kafka.api.key": "****************",
    "kafka.api.secret": "***************************",
    "connection.url": "https://es-host:port",
    "connection.username": "elastic",
    "connection.password": "************************",
    "type.name": "_doc",
    "key.ignore": "true",
    "schema.ignore": "true",
    "batch.size": "5",
    "tasks.max": "1"
  }
}
Click Launch.
-
After a few moments, the connector will be provisioned and shortly thereafter you should see that it is "Running" (alongside the existing connectors that you created in previous exercises):
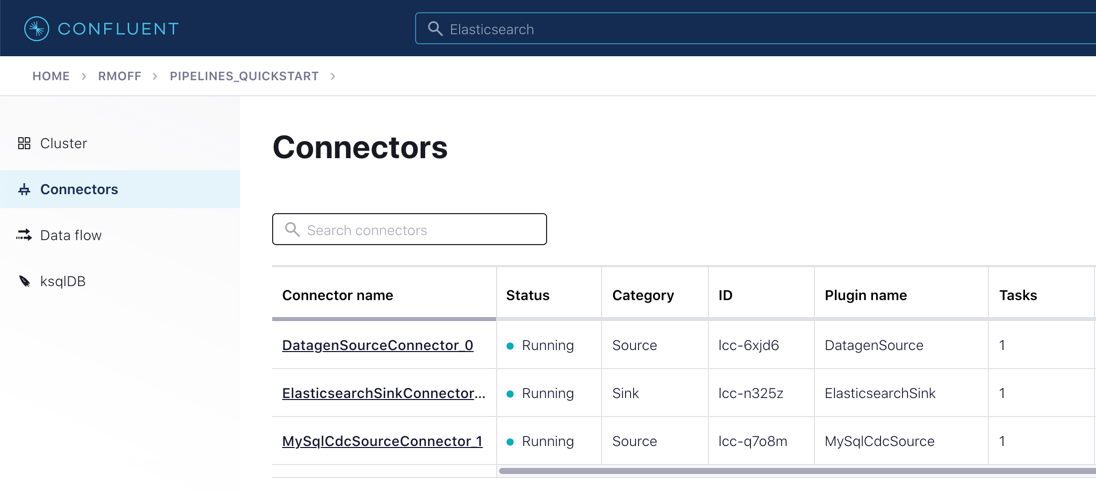
-
In Elasticsearch, check that data has been received in the index. You can do this using the REST API or with Kibana itself. Here’s an example using curl to do it:
curl -u $ES_USER:$ES_PW $ES_ENDPOINT/_cat/indices/ratings\*\?v=trueYou should see a reponse from Elasticsearch that looks like this:
health status index            uuid                   pri rep docs.count […]
green  open   ratings-enriched Wj-o_hEwR8ekHSF7M7aVug   1   1     101091 […]
Note that the docs.count value should be above zero.
-
You can now use the data. In our example, we’re streaming it to Elasticsearch so as to be able to build an operational dashboard using Kibana. The following assumes that you are familiar with the use of Kibana.
-
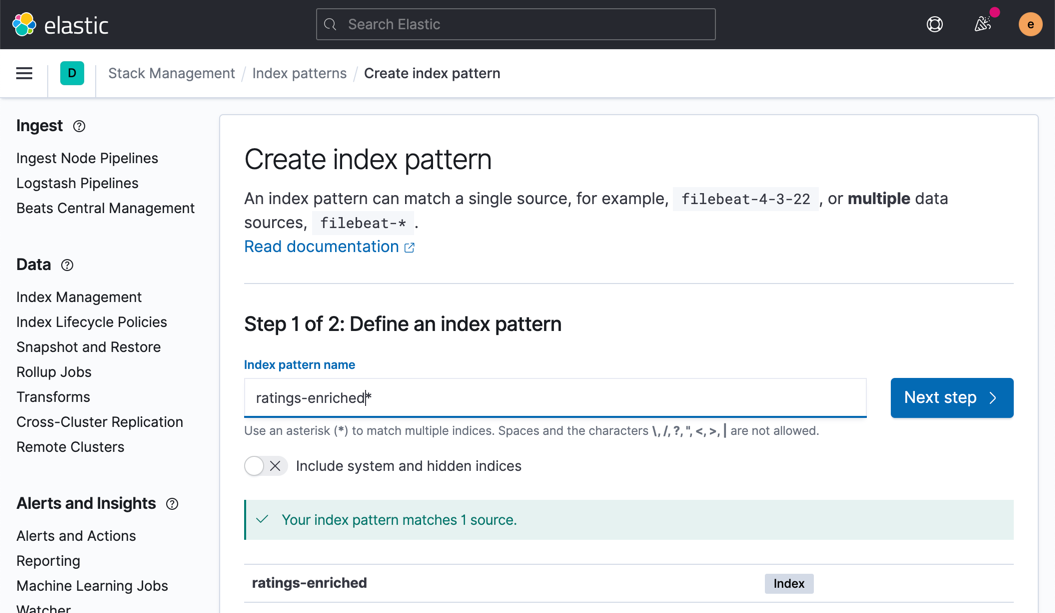
In Kibana, create an index pattern for the ratings-enriched index, with RATING_TS as the time field.
-
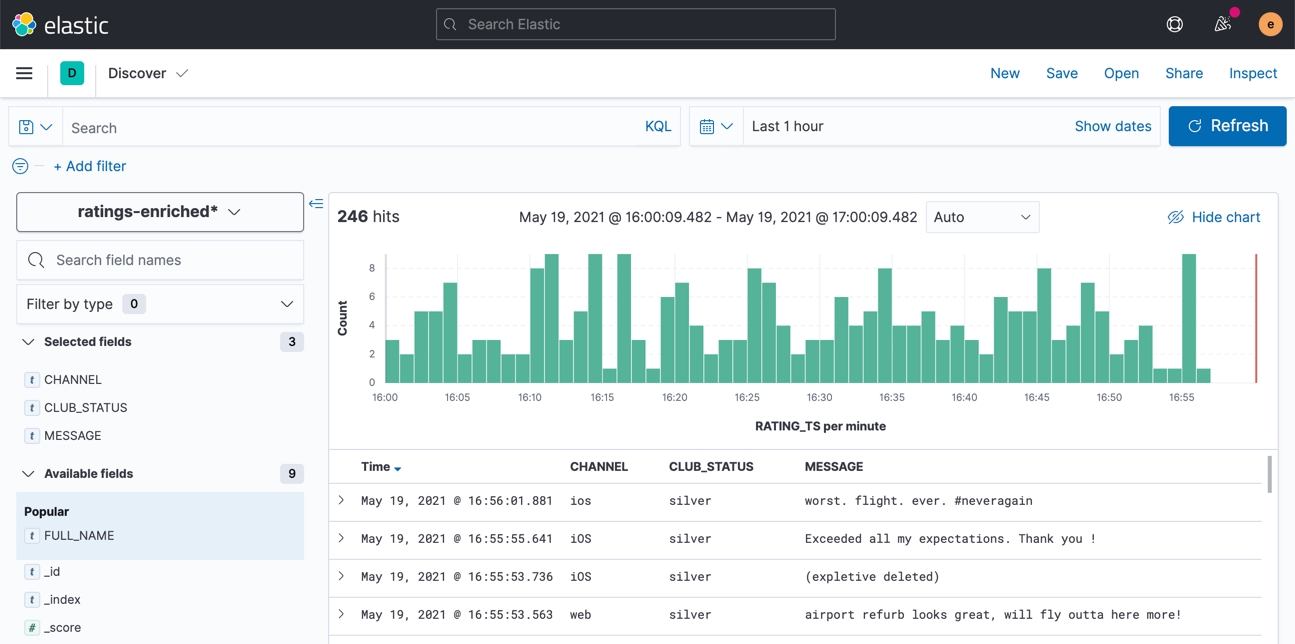
Use the Discover view to explore the data and its characteristics
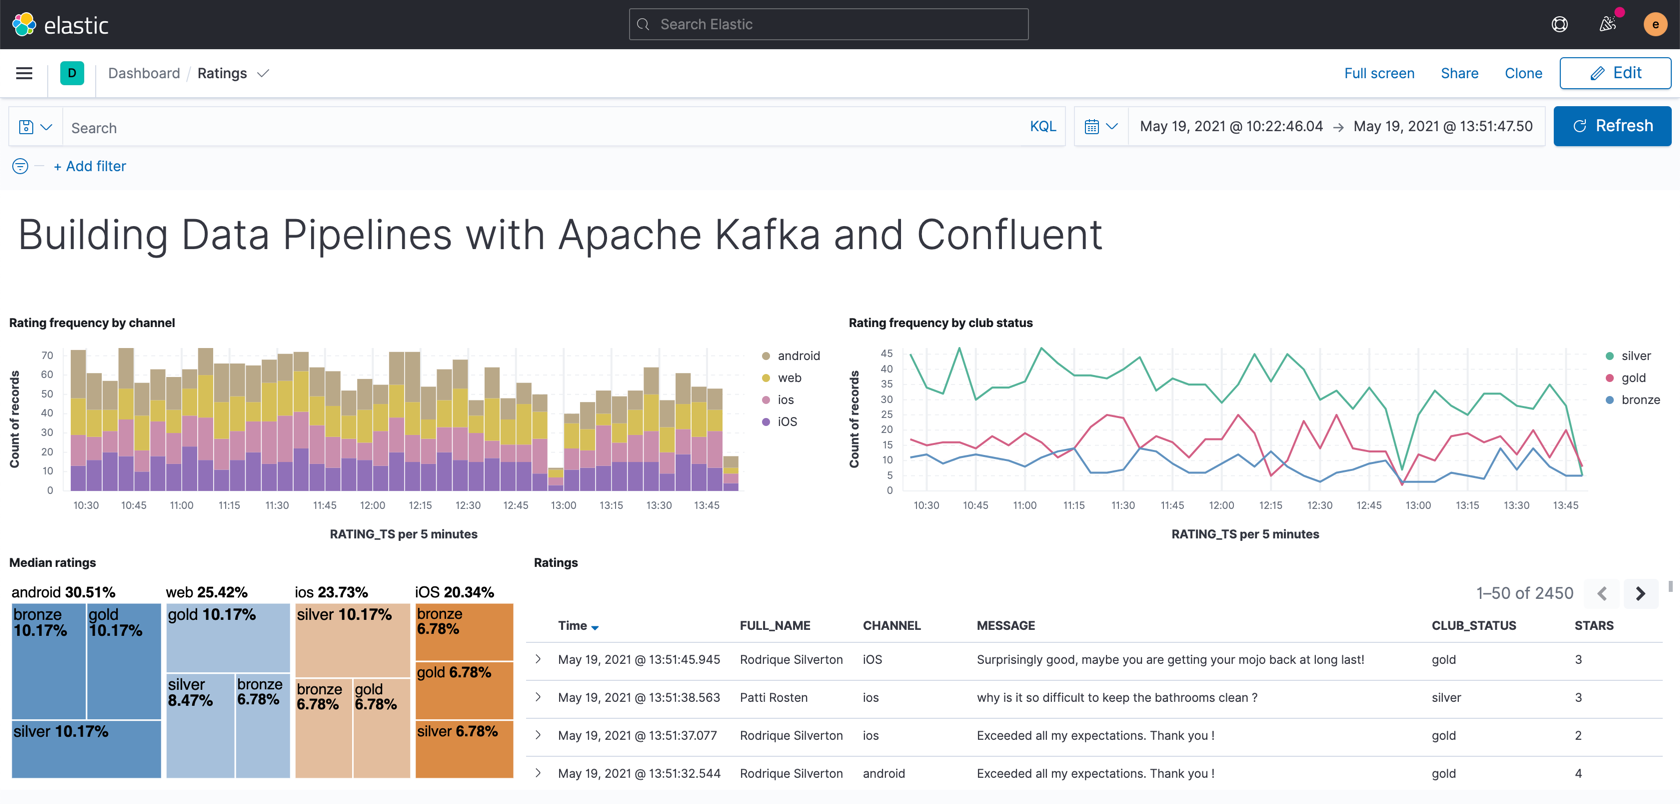
Create visualizations to build a dashboard showing relevant details in the data.
-


Note
Make sure that when you have finished the exercises in this course you use the Confluent Cloud UI or CLI to destroy all the resources you created. Verify they are destroyed to avoid unexpected charges.
Post-Course Survey
We'd appreciate feedback on the course. Please click below to take our short post-course survey.
- Previous
- Next
Use the promo code PIPELINES101 & CONFLUENTDEV1 to get $25 of free Confluent Cloud usage and skip credit card entry.
Hands On: Streaming Data from Kafka to Elasticsearch with Kafka Connect
In this last exercise, what we're gonna do is take our enriched stream that we've created and write it out using Kafka Connect to a sink system. That's gonna be Elasticsearch. And there we're gonna be able to create a real time dashboard around it. Let's dig in. From our cluster's home page, we can head to the topic screen and see the topic we created at the last step in exercise five in this pipeline. There's new messages arriving there, along with the ones we had there already. That's good. And each time someone leaves a new rating on our fictional website, it's received into the Kafka topic, enriched to include customer information and written here. We want a dashboard of these things. So what do we do? Head over to the connectors page and look for Elasticsearch Service Sink. Let's see, we'll select the ratings enriched topic. Remember we hard-coded that topic name? So it would be sensible here. Specify the API key, so the connector can access the Kafka cluster as before. Please, reuse the one you created in an earlier exercise. If you've lost it, you can create a new one, but don't go crazy making new ones. They're not quite like potato chips. We'll specify the end point and credentials for our Elastic instance. And remember that this needs to be accessible from the internet. Again, if this is just running in Docker locally on your laptop, that's probably not gonna work. Fill out the rest of the details for how to handle the messages being sent from Kafka to Elasticsearch, click next, and it'll validate our connection to Elastic. And we can check that JSON config against what all the things we had entered, and then, finally, click launch. Once the connector is running, you can click on it and see throughput rate and that sort of thing. From the cluster menu, you can list the consumers and see the connectors lag against each partition. This connector being a sink connector is gonna function as a consumer. Over here in Kibana, we can see that the index has been created in Elasticsearch and there are docs in it. That's the docs count column incrementing there. The mappings of the fields, they look good, including the rating TS as a date type, that's nice. And we'll create an index mapping in Kibana, so that knows what fields are in the data. Then we'll head to discover and add fields to the view. Note how the new messages are arriving all the time. Each time we refresh, we see more. Let's see, we'll save the view now. So you can add it to a dashboard and create a new dashboard and add the view that we just created. There we go. With that, we've got our sink connector set up. We've got a nice little dashboard set up in Kibana over our data in Elasticsearch, and our pipeline is complete. If you followed along, you've done all these things. Well done.
Be the first to get updates and new content
We will only share developer content and updates, including notifications when new content is added. We will never send you sales emails. 🙂 By subscribing, you understand we will process your personal information in accordance with our Privacy Statement.